I-Scan System
The versatile I-Scan tactile pressure mapping system is tailor-made by choosing from over 200 pressure sensors to meet your specific application requirements.
Not available for online purchase.
Contact us for pricing
Have questions? Contact Us
The versatile I-Scan tactile pressure mapping system is tailor-made by choosing from over 200 pressure sensors to meet your specific application requirements.
Not available for online purchase.
Contact us for pricing
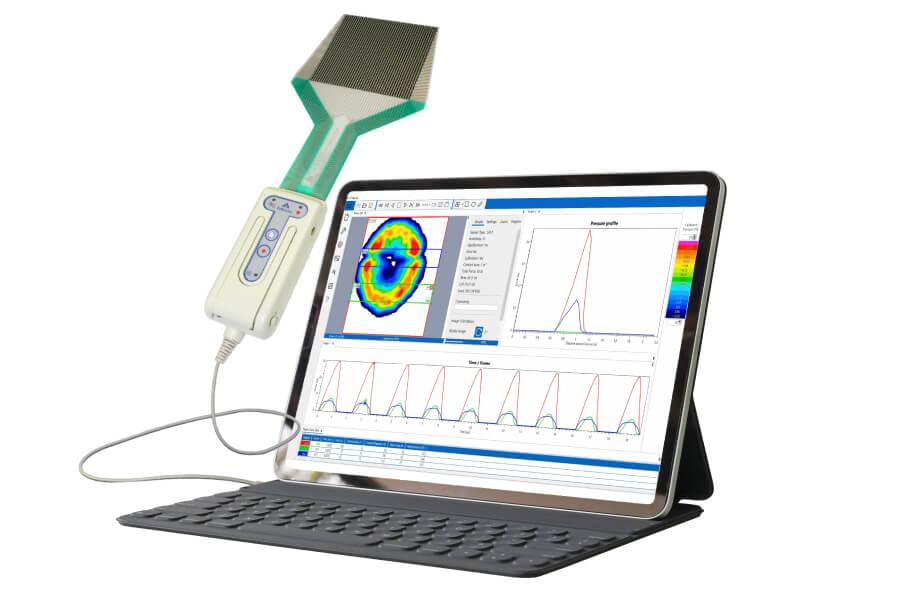
I-Scan™ is a powerful tool that accurately measures and analyzes interface pressure between two surfaces, utilizing a thin and flexible sensor. The system is comprised of data acquisition electronics, sensors, and software. Measuring both force and pressure, the exceptionally thin tactile sensor provides minimal interference between the objects being measured, allowing the true interface pressure data to be obtained. The interface pressure data collected offers vital information and insight to enhance product design, manufacturing, quality, and research.
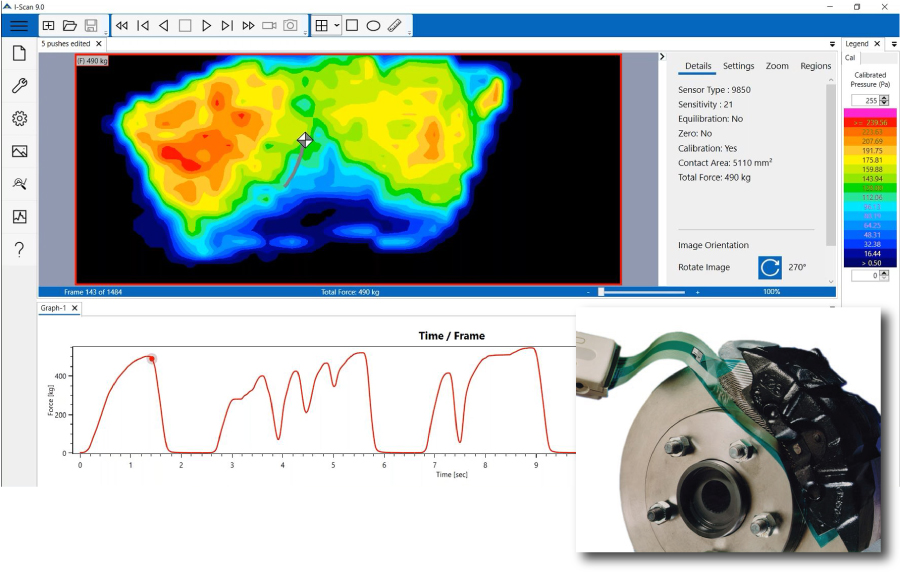 Standard I-Scan software window displaying the pressure distribution across a brake pad and rotor. Standard I-Scan software window displaying the pressure distribution across a brake pad and rotor. |
Key Data
|
Utilization
|
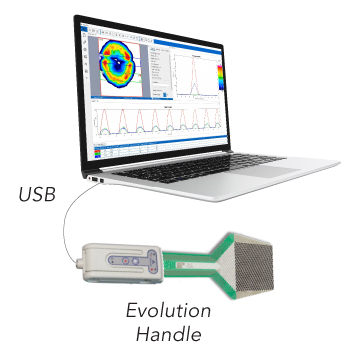
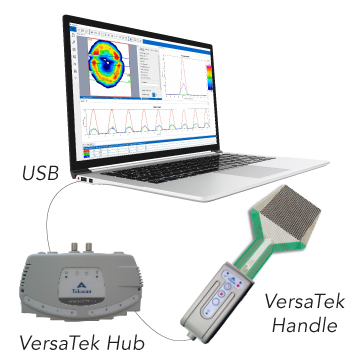
I-Scan™ offers different options for data acquisition electronics. To help you choose the best fit for your application, explore the configurations below or download the I-Scan Product Selection Guide for more detailed information and specifications on the various system options, features, and configurations.
I-Scan Product Selection Guide
For use in standard applications. Up to 100Hz scanning speed.
 |
|
For use in high-speed applications (up to 20,000 Hz) or for sensors with higher resolution over large areas.
 |
|
Wirelessly transmit data to PC for remote data collection (up to 100 m). Up to 4,600 Hz scanning speeds.
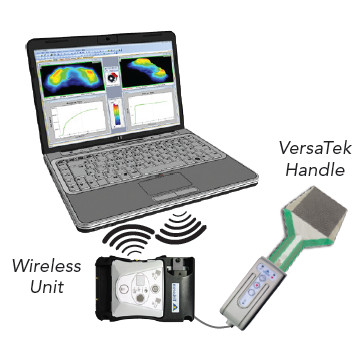 |
|
Collect data onto Datalogger Unit and upload to PC after data collection. For wireless use at higher speeds & noisy environments. Up to 20,000 Hz scanning speed.
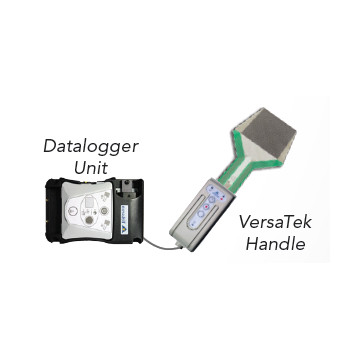 |
|
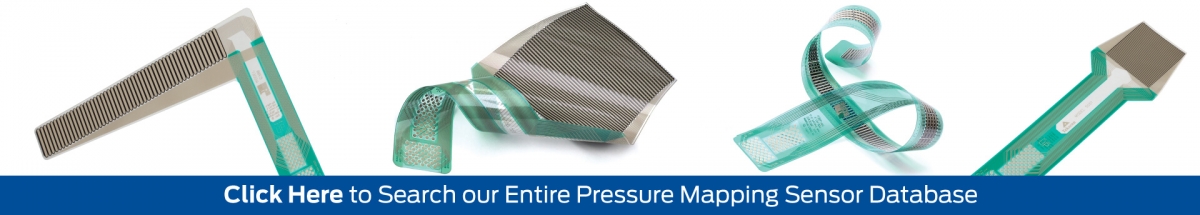
Over 200 flexible, thin film tactile pressure sensors are available in different sizes, shapes, resolutions, temperature ratings, and pressure ranges (up to 25,000 psi or 1,700 bar).
I-Scan™ provides the tools for more comprehensive and higher quality analysis than ordinary pressure sensing technologies.The software displays the pressure distribution data, in multiple formats, for superior analysis.
|
|
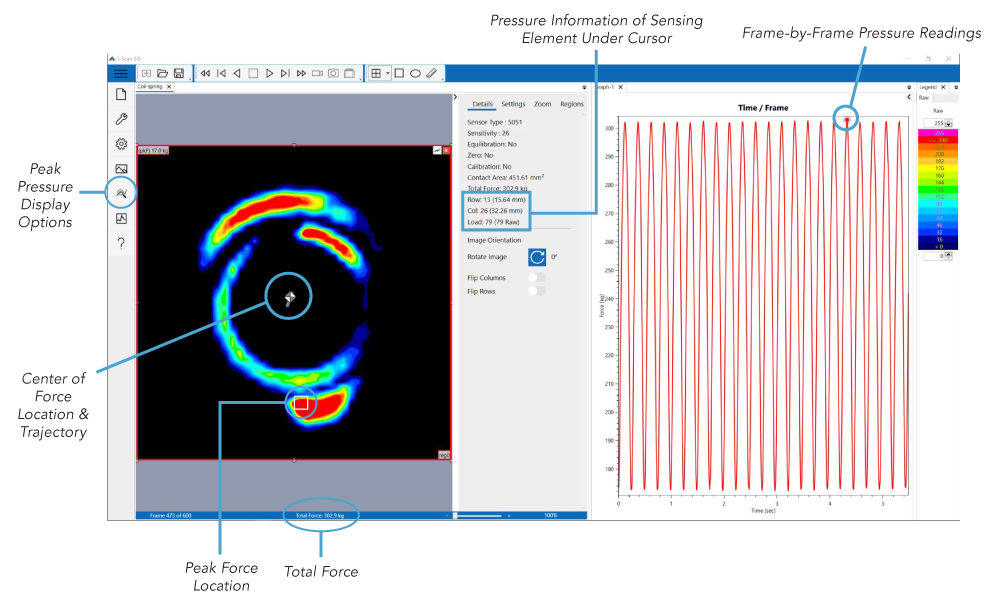
Graphic & Data AnalysisWith the ability to capture force over time, users can click at any point of a pressure mapping recording to view the resulting pressure output image. Data from each frame includes:
|
|
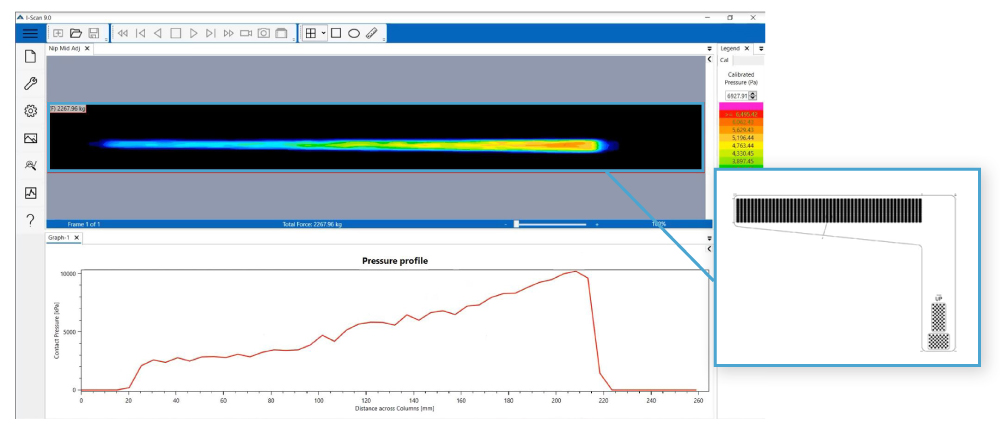
Sensor MAPsEach sensor requires its own unique MAP driver file for the software to function properly. By utilizing sensor MAPs, the software is able to provide an accurate depiction of each unique sensor layout. The sensor MAP controls the shape of the pressure image window in the software, which corresponds to the shape and dimensions of the sensing area on the sensor. |
|
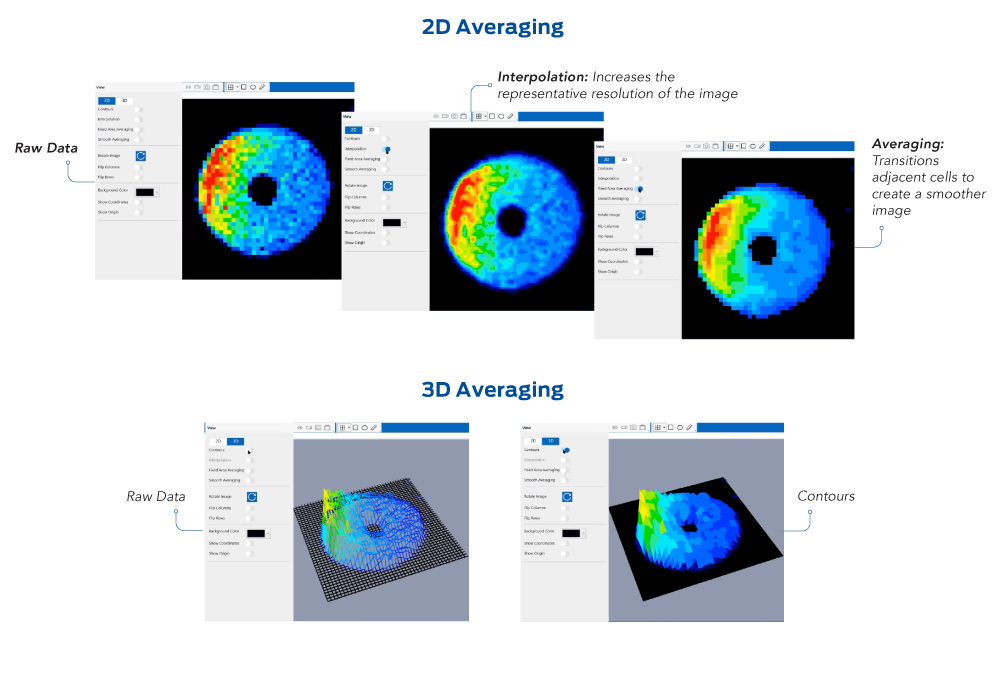
VisualizationI-Scan 9 offers optimized 2D and 3D display algorithms in the software to average sensor data into a smooth pressure map display; giving a more realistic representation of the object being measured. Select among several averaging views, including combination views. |
|
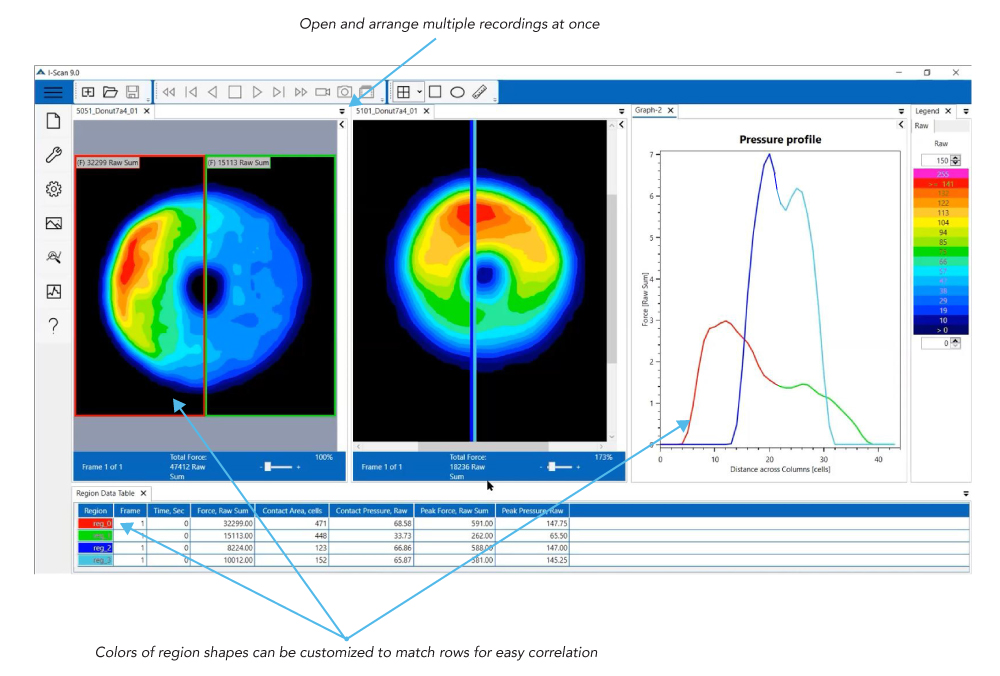
Property TableI-Scan’s integrated property table displays key metrics of all regions placed on multiple data sets being analyzed simultaneously. Total Force, Contact Area, Contact Pressure, Peak Force and Peak Contact Pressure are displayed to allow for in depth comparison of multiple tests. Colors of region shapes can be customized to match names of rows for easy correlation. |
 |
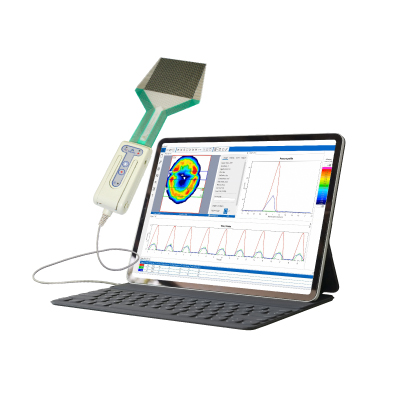
I-Scan Evolution software can run from a tablet operating on Windows 10 or 11, 64-bit version. (ARM CPU not supported). This feature makes your I-Scan system more portable and provides other capabilities, including:
Requirements include:


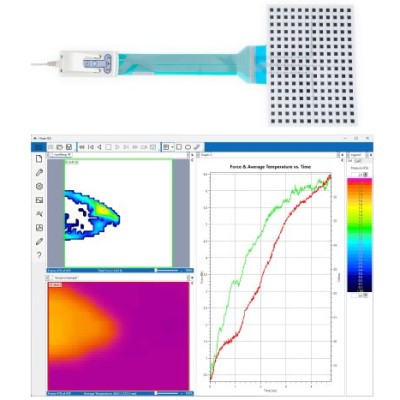 Temperature and Pressure Mapping Data Side by Side Temperature and Pressure Mapping Data Side by Side |
Add Temperature Mapping to your I-Scan Pressure Mapping SystemCorrelate Pressure & Temperature in one data setBy overlaying temperature mapping data with pressure mapping, the I-Scan reveals critical relationships between pressure and temperature affecting product performance and reliability. You can see the real time data capture on the left, and the graph of changes over time in the software data display on the right.
|
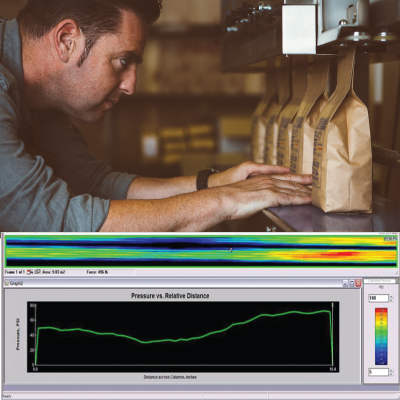 |
Challenge:To establish baseline metrics for proper alignment of a high-temperature sealing bar machine.
Solution:High-temperature I-Scan systems allows the operator to make routine adjustment to the maturing surfaces of the sealing bar.
|
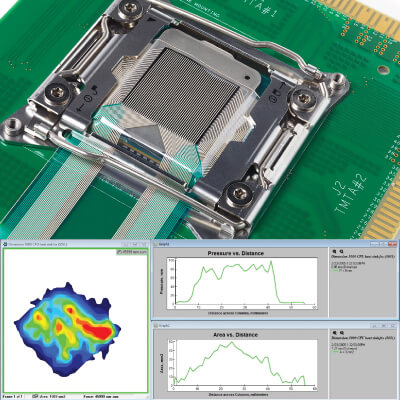 |
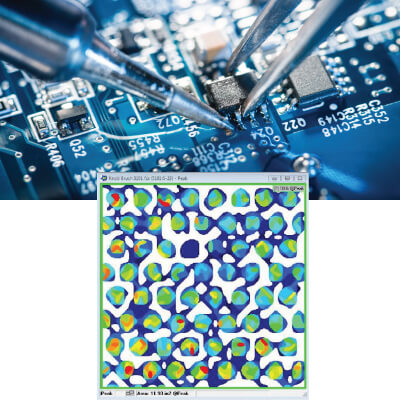
Challenge:To measure and ensure contact pressure between a heat sink and heat source on a circuit board.
Solution:The ultra-thin I-Scan sensor could be easily inserted between the two rigid mating surfaces to evaluate and improve contact.
|
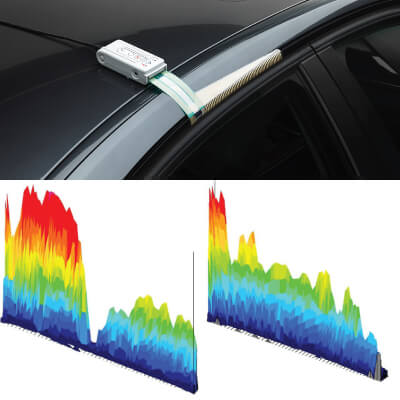 Image on the left shows pressure output before adjustments, while the right shows ideal pressure output after adjustments were made. Image on the left shows pressure output before adjustments, while the right shows ideal pressure output after adjustments were made. |
Challenge:To analyze the contact pressure between a door and the rubber seal on a vehicle.
Solution:The I-Scan system functions as an electronic "feeler" gauge to measure contact pressure while also acting as a direct feedback mechanism.
|
 |
Challenge:To obtain clear, verifiable data on how a robotic manufacturing system performs very specific movements.
Solution:An I-Scan system used as part of the operation's machine setup procedure was used to verify all robotic elements were interfacing properly.
|
Explore More Application Stories
There have been a number of research projects conducted where Tekscan's pressure measurement technology has played a crucial role. To view the list of these research studies, download the bibliography for Pressure Mapping Applications.
|
|
|
|
|

Tekscan has enhanced the I-Scan™ platform with a new thin-film temperature mapping capability, enabling you to capture detailed temperature distribution across a surface—or in between two surfaces where thermal cameras can’t.

Mechanical and thermal dynamics within a battery are closely linked—yet often difficult to measure. This updated eBook shows how integrating both pressure and temperature mapping into your test and validation process can uncover failure risks, optimize materials, and improve cell and module performance.

Pressure mapping technology has shown to be a proven tool to help R&D teams of all types capture actionable data that optimizes product development and opens new opportunities to improve manufacturing procedures.

Want to know how our pressure mapping sensors are made, and how they work? This short video provides a visual overview of Tekscan's pressure mapping sensor technology.

Review of Load Cells, Pressure Indicating Film, and Tactile Pressure Sensors for Improvement of Research and Quality Control.