Skip to main content

Pressure Mapping Technology
Measure interface pressure between two surfaces, utilizing a thin and flexible sensor. The resulting data and our analysis tools offer insights to enhance product design, manufacturing, quality, and research.
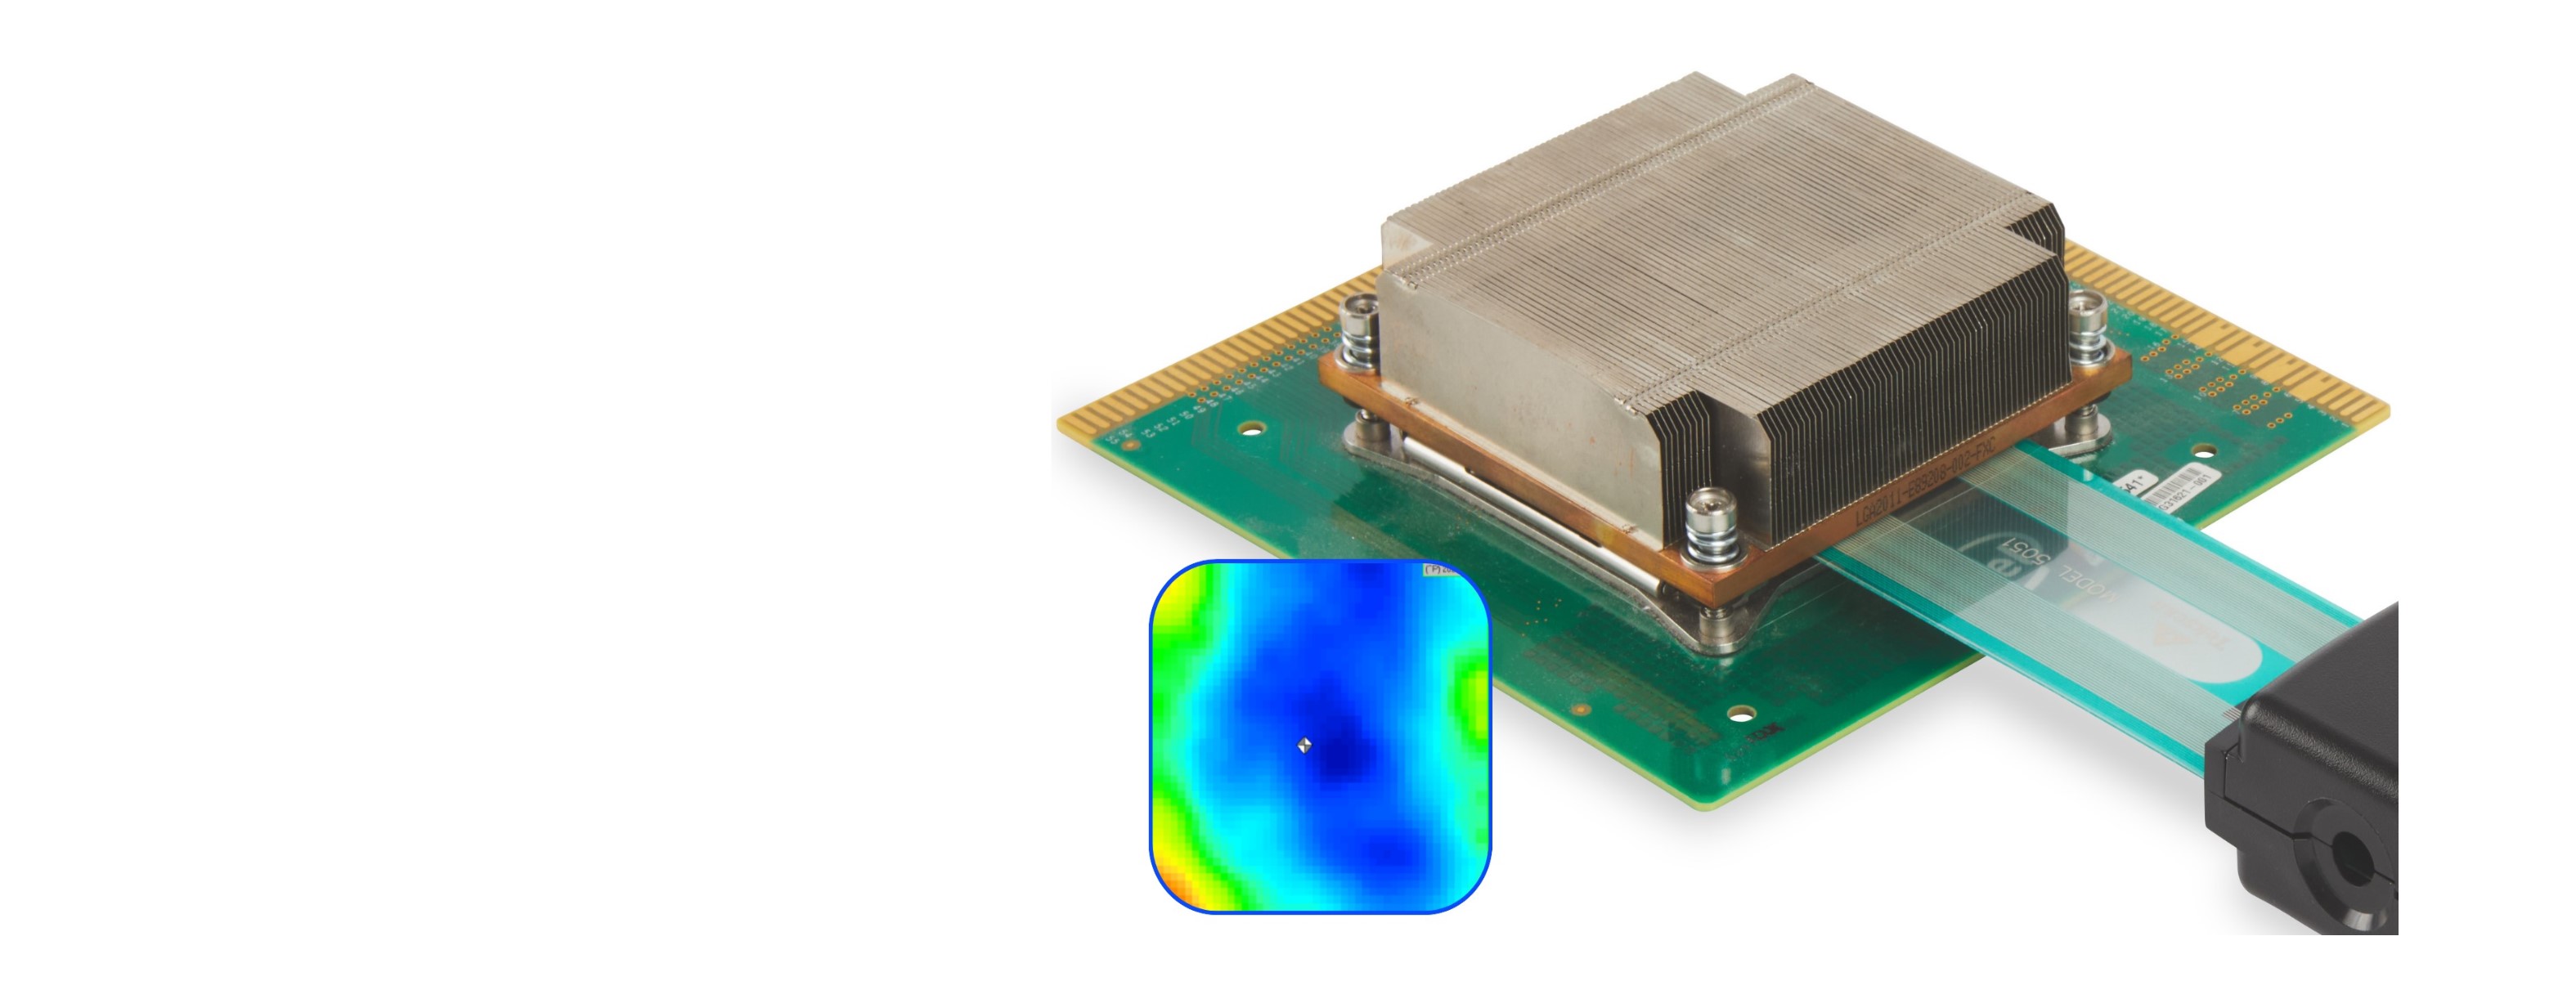
What is a Pressure Mapping System?
Pressure mapping is a test & measurement technology and wide-reaching R&D tool. Companies have successfully used our systems to help solve application challenges, improve product design, and more.
Analysis tool that maps interface pressure and provides insight for a better understanding of surface behavior
- Provides key metrics including total force, peak pressures, and center of force
- Clear visual representation of pressure distribution
- Multiple graph options to plot data
- Access real time or recorded data
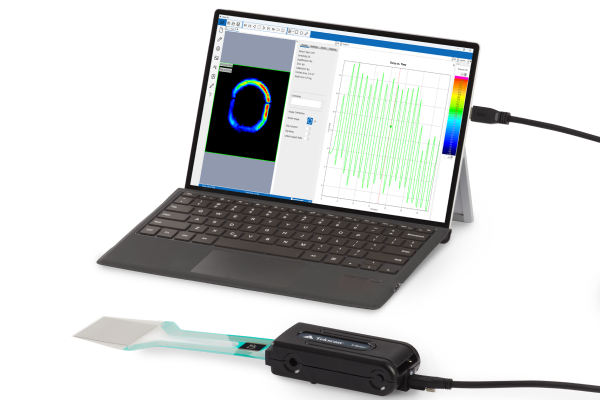
Components include: sensors, data acquisition electronics, and software
- Over 200 standard sensors with different shapes, sizes, resolution, and pressure ranges; custom sensors available
- High speed and wireless capabilities
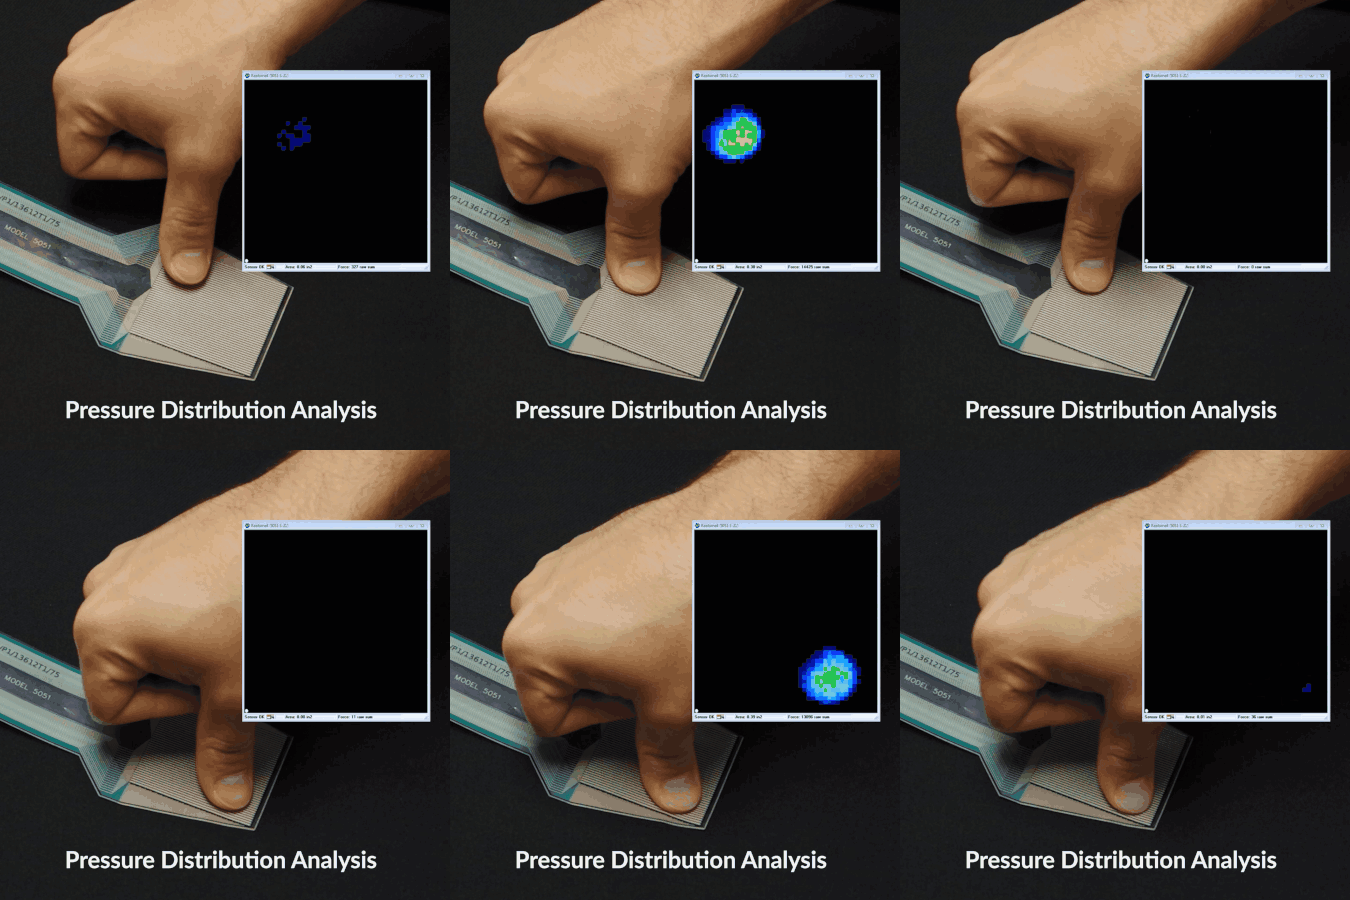
Our Pressure Mapping Systems
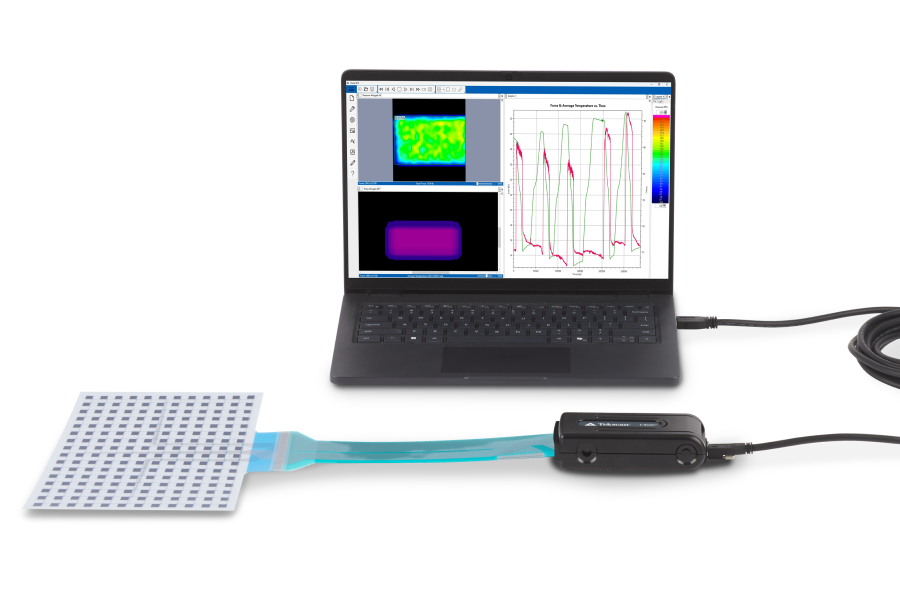
Measure and analyze interface pressure between nearly any two surfaces for applications and industries including automotive and semiconductors to name a few.

Improve tire designs, inside & out, with systems to analyze static or dynamic high-speed tire footprints, as well as tire bead seat & seal.

Optimize designs for bedding, cushioning, positioning, and seating.

Verify nip roll uniformity and eliminate machine set-up guesswork.

F-Scan™ GO in-shoe foot pressure mapping and gait analysis system.

Optimize battery performance, lifespan, and safety with Pressure & Temperature Mapping data.
Core Technology of a Pressure Mapping System
Sensor
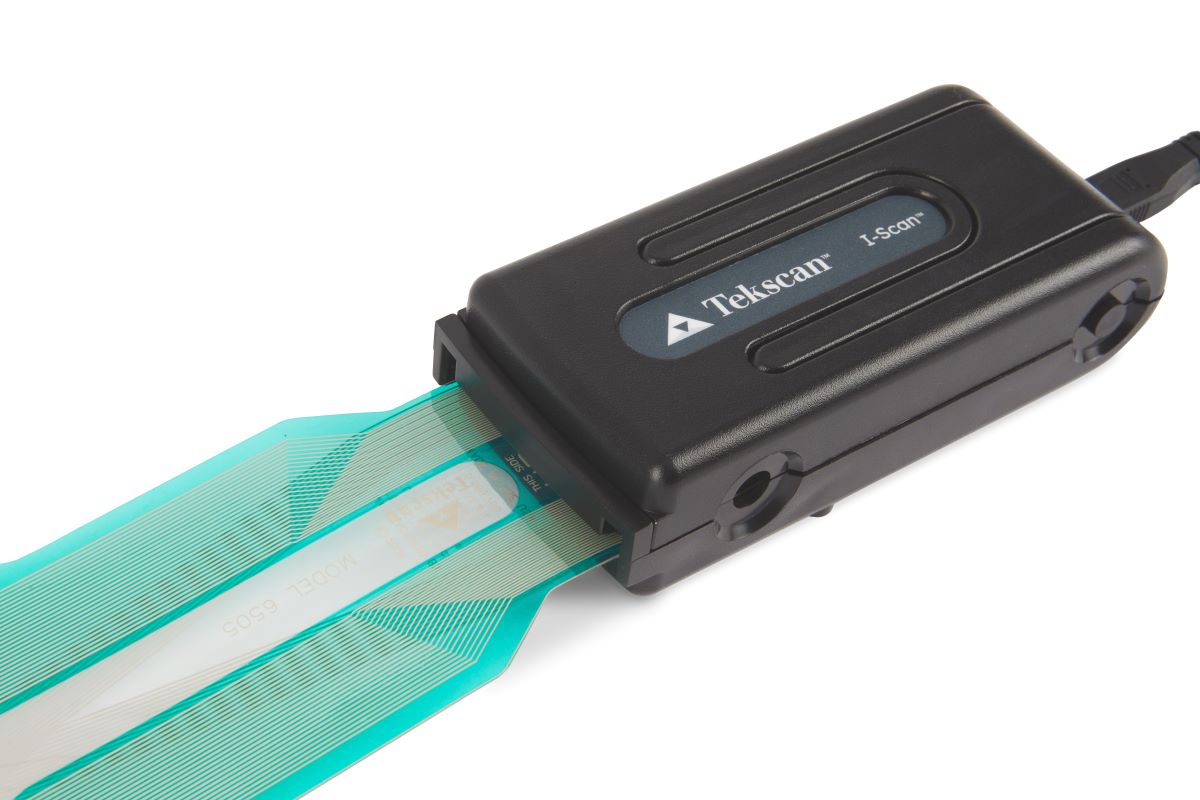
- Minimally invasive high resolution sensor that is thin and flexible.
- Over 200 standard sensors with different shapes, sizes, resolutions and pressure ranges
- Customizable to unique form factors and pressure ranges to meet specific applications
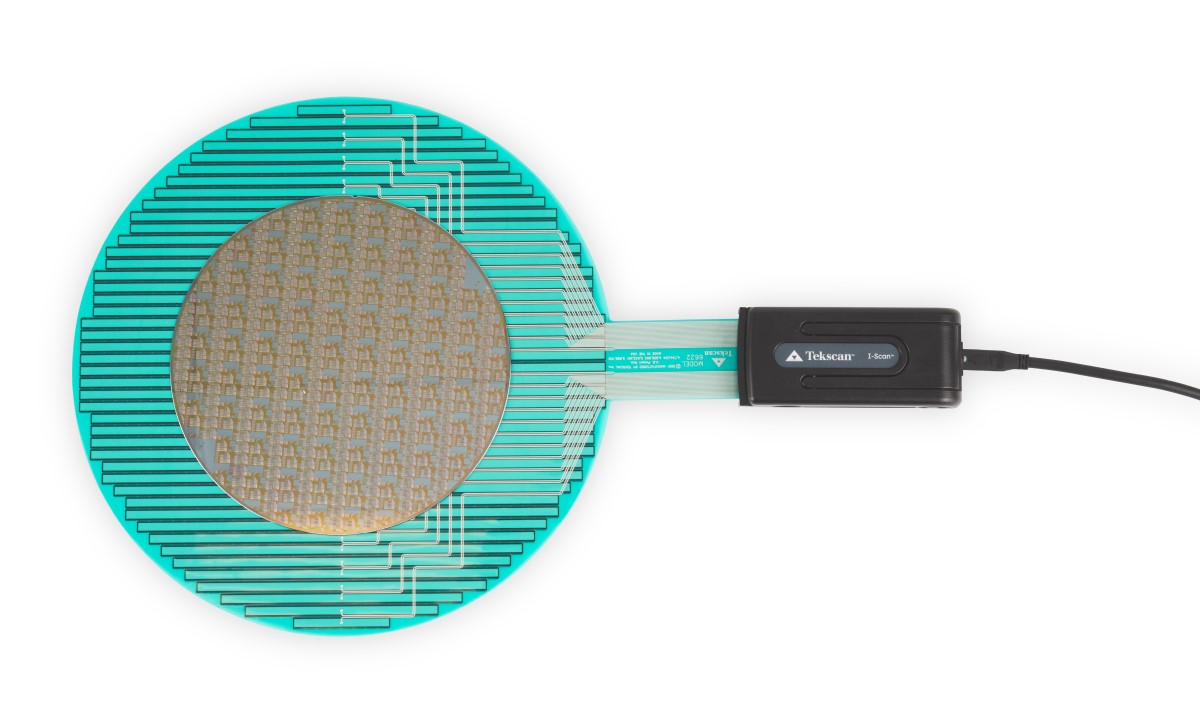
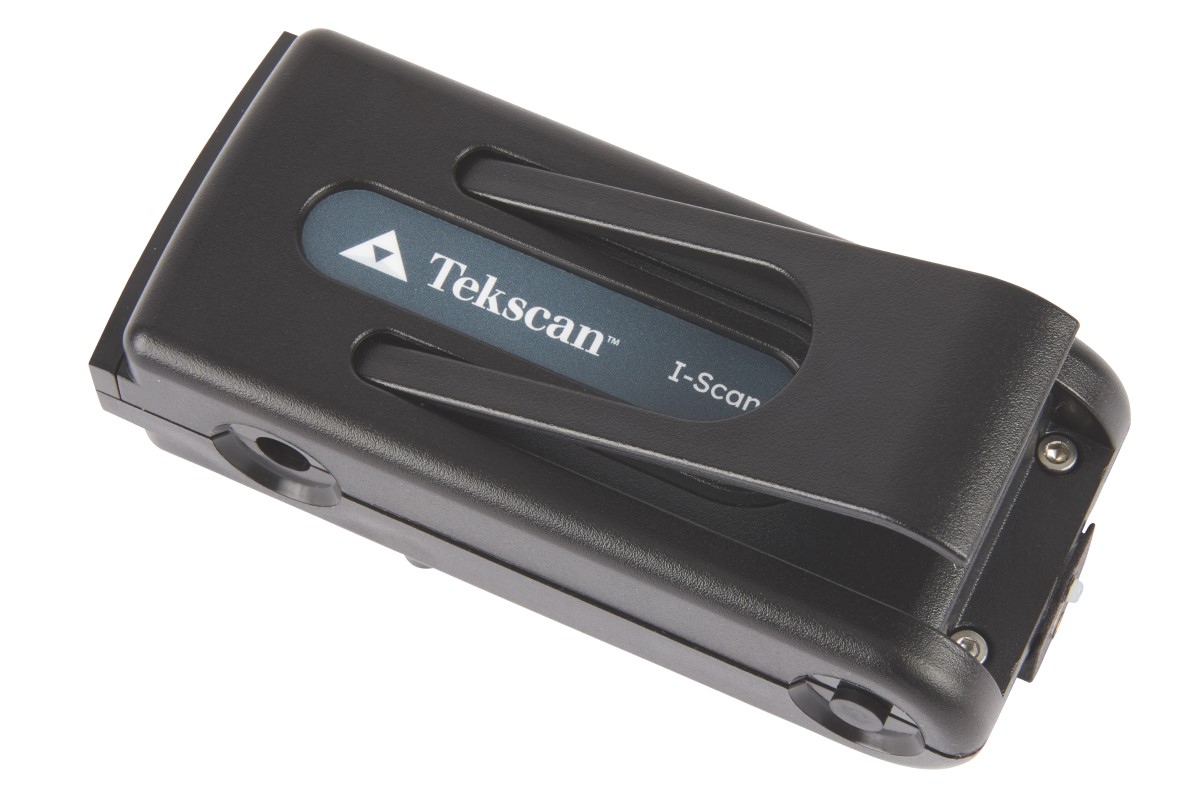
Electronics
- Scan thousands of sensing points within each sensor
- Data is instantly relayed to the software on your PC via a USB cable
- High speed and wireless options available
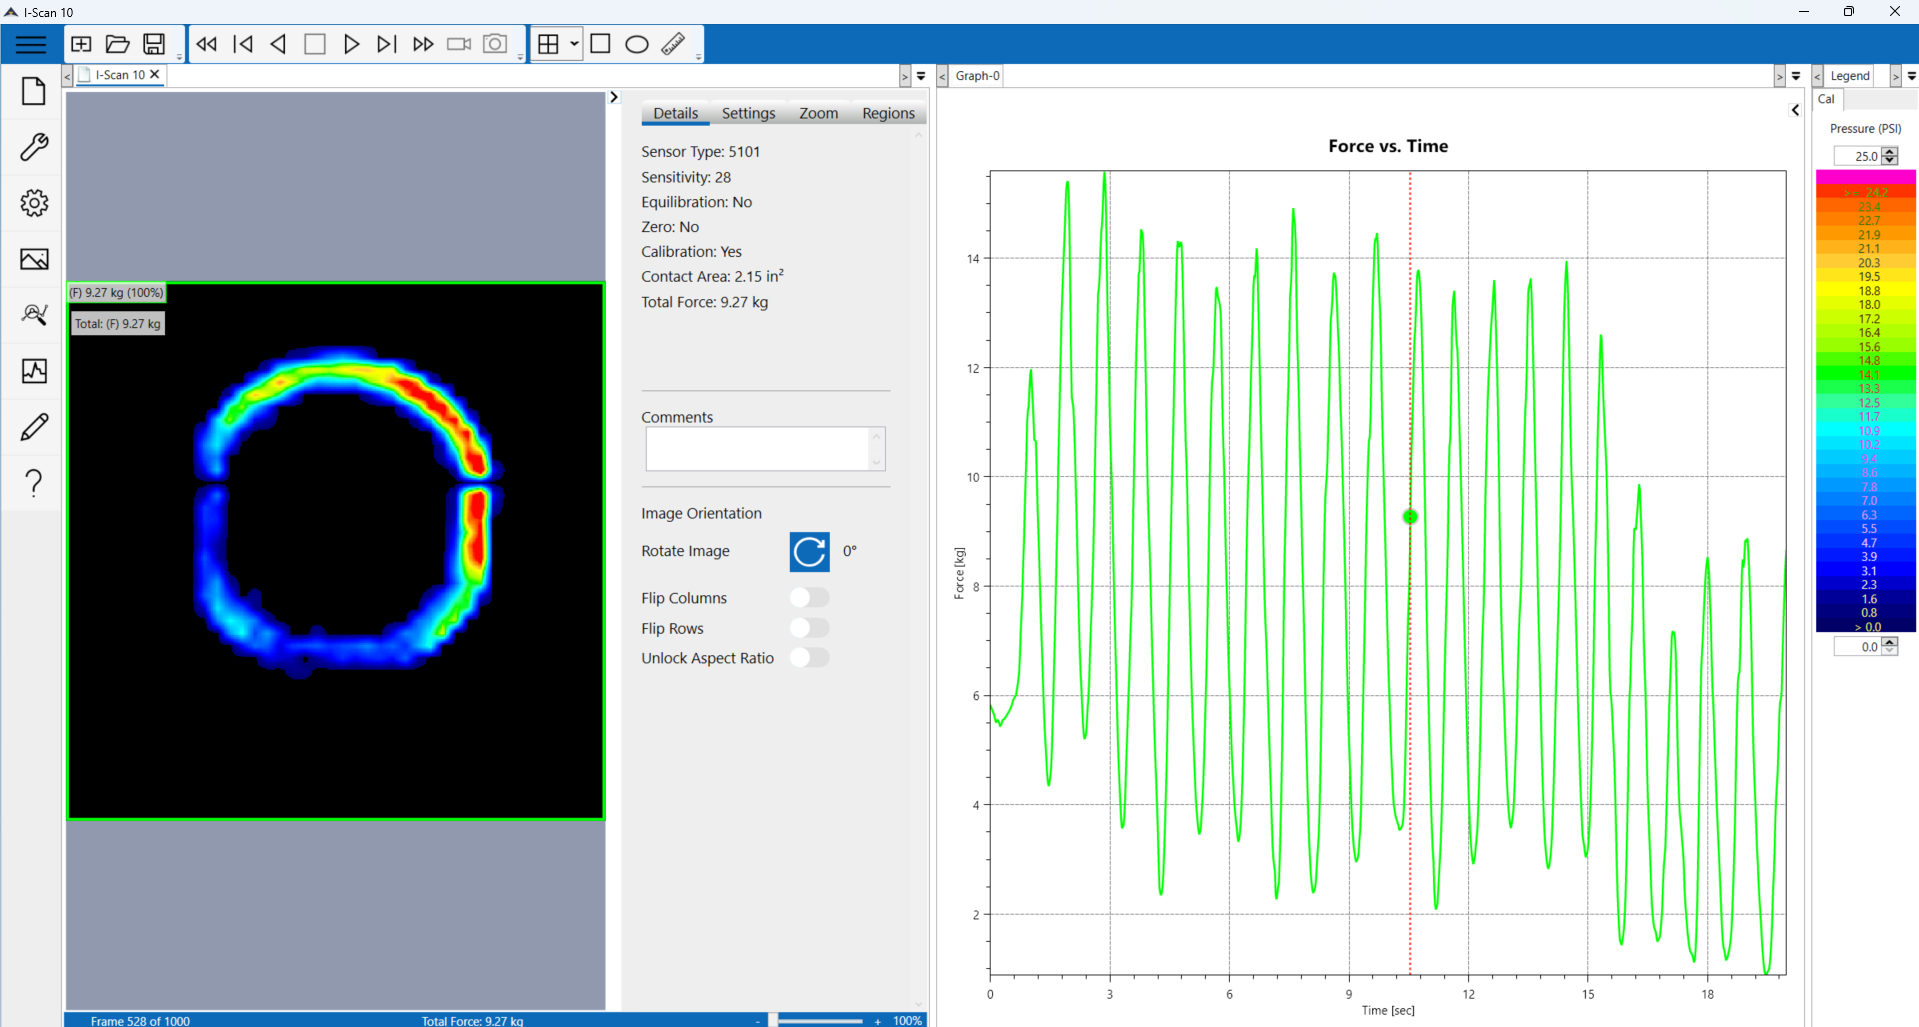
Software
- Software displays the pressure distribution data, in multiple formats, for superior analysis
- Real-time display of pressure sensor data in 2D & 3D
- Display peak pressures and center of force
"The Tekscan System Paid for Itself in the First Five Minutes"
Tekscan came in for a demonstration, and within five minutes we were watching a live output from our system and our jaws hit the floor. It literally made the pressure sensitive film we had been using look like bear skins and knives. It was that much of a quantum leap improvement. The Tekscan system paid for itself in the first five minutes. We got almost priceless information from it.
- Dave Otto, Former Senior Research Engineer, DuPont
- Evaluating component press fits and seals - For quality control, uniform sealing bars, and packaging machines are critical for efficient manufacturing.
- Evaluating product performance - Pressure mapping technology can provide instant, dynamic feedback on how a product will respond to long-term wear-and-tear.
- Machine design and setup precision - Machine alignment at setup with real data matters.
- Comfort and ergonomic assessment - From passenger comfort to seat structural design or ergonomic grip.
- High-speed impact testing - Whether for interior physical validation or high-speed crash testing, the I-Scan system can capture high resolution pressure data at up to 20,000Hz.
How Pressure Mapping Compares to Other Technologies

Load Cells
- Accurately measures force load on a single sensing point.
- Multiple load cells are required to measure a pressure array.
- Tend to be bulky, thus making them difficult to position in a manner desired for collecting relevant data
Pressure Mapping
- Sensors are minimally-invasive, making it a viable testing solution for examining pressure between nearly any two mating surfaces
- Captures the entire range of pressure occurring over the entire test.
- Software recording & analysis features allow the user to analyze real-time data, an export into user-friendly file formats
- Systems can be calibrated to a known force for more precise data collection.

Pressure Indicating Film
- An affordable single-use method to capture the moment of peak pressure during a testing process.
- Does not provide evidence of when that peak moment occurred in the testing process.
- Only displays a degree of pressure in a single test, cannot be calibrated.
Learn the pros and cons of using pressure indicating film versus tactile pressure sensors.
The pros and cons of using pressure indicating film versus tactile pressure sensors. Download this Article Now.
Pressure Mapping Technology Uses in R&D
Pressure Mapping FAQs
How do I choose a pressure mapping sensor for my application? - Choosing the right sensor comes down to 5 simple but important application variables.
Can I adjust the pressure range of a sensor? - Yes. Adjustable sensitivity, or adjustable gain allows you to make on the fly adjustments in the software if you find unexpected localized peak pressures. This makes your pressure mapping system and sensor as versatile as you might need. And future adjustments, or re-equilibration, will extend the life of the sensor and maintain a useful output for your application.
Learn More about Pressure Mapping for Research & Development
See how pressure is distributed between two contacting surfaces. A thin, flexible sensor measures pressure across the contact area, and software converts the data into a visual map. This helps reveal areas of concentrated or uneven pressure, and how it changes.