
A New Layer of Insight: How Temperature Mapping Reveals Hidden Risks in Battery Formation

Part 3 of our “Impactful Insights” Interview Series with Tekscan’s Evan Griffith
In Part 1, we explored how real-time pressure mapping helps engineers visualize internal force distribution during battery testing. Part 2 dove into stack pressure and its impact on SEI layer formation.
Now, in the final installment of our Impactful Insights interview series, Evan Griffith shares how temperature mapping—a new addition to Tekscan’s sensing platform—is helping battery engineers uncover thermal inconsistencies that pressure data alone can’t detect.
Q: Evan, why did Tekscan expand into temperature mapping?
Evan: Pressure data tells part of the story, but temperature plays just as critical a role—especially in formation and fast-charging applications. Batteries heat up during charge and discharge cycles, and uneven heating can create stress, cause delamination, or degrade materials. We wanted to give engineers a way to visualize that temperature behavior in real time, just like they can with pressure.
Q: What’s the main difference between temperature mapping and using thermocouples or IR cameras?
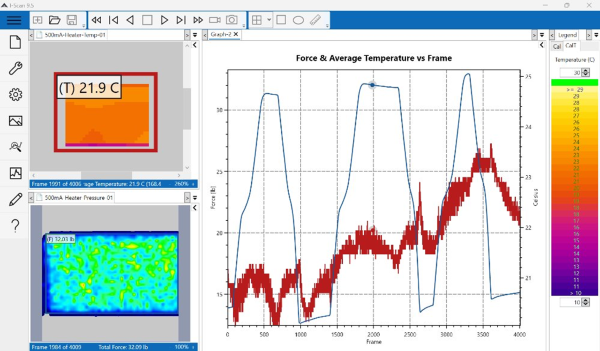
Evan: Temperature mapping paints an entire spatial picture with respect to how heat is flowing; thermocouples only provide data in one single point location and IR cameras cannot measure temperature between two surfaces. We’ve run tests using both a pressure sensor and temperature sensor together during charge/discharge cycles. For example, with a 500 mA discharge current, we saw only a ~1°C rise in temperature. But when we increased to 1.5 A, the battery showed a >4°C spike—enough to raise concerns during formation.
That difference wouldn’t be visible with a single thermocouple. But with temperature mapping, engineers can pinpoint where the heat is building up, not just how much.
Q: Can you combine temperature and pressure data in one view?
Evan: Yes—and that’s the beauty of it. Both sensors connect to the same platform and can run side-by-side in the same software interface. Engineers can correlate pressure shifts with temperature changes frame-by-frame.
Let’s say you’re seeing uneven pressure during formation—and you also notice localized temperature spikes in the same region. That could indicate a fixture misalignment, material defect, or a chemistry issue. Correlating the two makes it much easier to troubleshoot and optimize your design or process.
Q: How easy is it to integrate this into an existing setup?
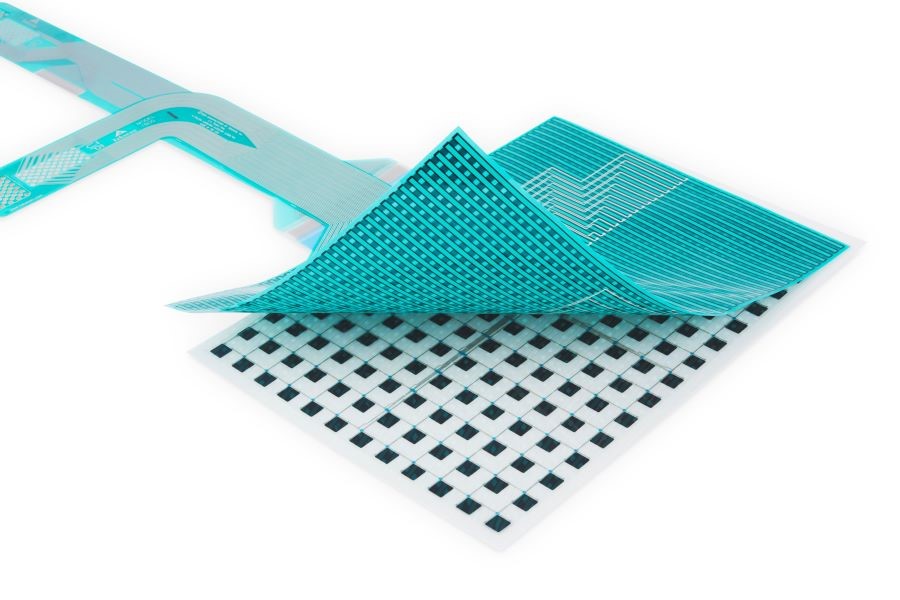
Evan: Very easy. The temperature mapping sensors are just as thin and flexible as our pressure sensors, and they’re trim-to-fit. For battery applications, the temperature mapping sensor even has a similar form factor and can be trimmed in a similar way as our popular battery pressure sensor. That means you can adapt them to the size and shape of your cell or fixture without major rework. It’s a great tool for both lab-based R&D and early-stage process development.
Q: What’s the takeaway for battery engineers?
Evan: Mechanical and thermal forces are deeply interconnected in every battery application. If you’re only monitoring one, you’re only seeing part of the picture.
Our goal with temperature mapping was to make thermal behavior as visible and measurable as pressure—so engineers can design better, test smarter, and manufacture more safely.
See it in Action – Watch the On Demand Webinar
Want to see temperature and pressure mapping in action? Watch Evan Griffith’s full webinar for live test demos, real sensor data, and setup tips
Now available on demand — watch anytime.
Post Categories: