
Early Mechanical Failure: How Spatial Pressure + Temperature Mapping Reveals Early Battery Cell Risks
In EV battery manufacturing, the pressure that individual cells experience inside a pack tells a powerful story. Some variation is both expected and benign: cells settle, tabs flex, thermal expansion occurs. But when early mechanical failure modes begin to emerge, such as gas-induced swelling, internal delamination, tab-to-connector loosening, or early stages of an internal short, the resulting pressure signatures start to deviate in distinct and localized ways. Identifying these red flags early can help prevent costly failures down the road.
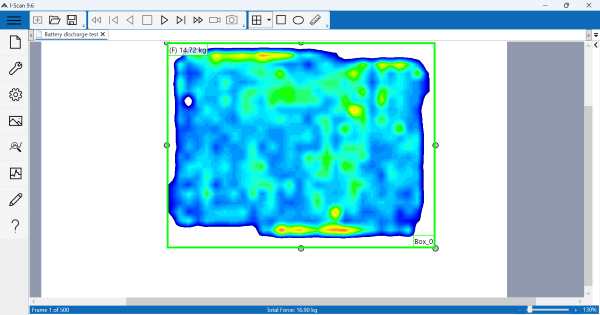 Blue and green indicate normal pressure variation; red areas show higher, potentially concerning pressure concentrationsPressure variation and failure modes
Battery cells are inherently dynamic: as they charge and discharge, as thermal expansion occurs, as mechanical clamping forces shift, the contact pressure within a pack — and at the cell/module interface — moves with them. These changes may manifest as small spatial variations in pressure that fall within normal operating parameters.
By contrast, early mechanical failure modes typically create distinctive pressure and temperature patterns that look very different: localized pressure spikes from swelling or gas generation, sudden pressure drops from contact loss or delamination, or asymmetric pressure behavior across adjacent cells. These events often also produce correlated thermal anomalies, such as heat generation from increased internal resistance, hotspots due to contact loss, or reduced cooling efficiency due to swelling. The table below summarizes how to distinguish expected variations from early indicators of mechanical failure.
| Expected/Benign Pressure + Temperature Changes | Early Failure Indicators |
|---|---|
| ✅ Small shifts as cells settle | ❌ Local pressure “hot spots” |
| ✅ Slight tab flex or tolerance-related variation | ❌ Sharp pressure drops (contact loss) |
| ✅ Uniform changes from thermal expansion | ❌ Asymmetric or localized anomalies |
| ✅ Gradual redistribution of clamping force | ❌ Combined pressure + temperature hotspots |
We see this often in customer labs: teams can detect change, but their existing tools don’t localize where it’s happening or why. During demos, it’s common to see engineers genuinely surprised by what the spatial data reveals. Pressure and temperature mapping provides that missing context — helping them distinguish normal cycling from localized defects and make confident decisions.
- Evan Griffith, Tekscan Product Manager
The challenge: distinguishing normal vs. abnormal
From a quality and reliability standpoint, one of the major hurdles is knowing when a pressure deviation is within acceptable bounds vs when it signals the start of a failure chain. Traditional point sensors (single pressure transducers, spot thermocouples) may flag that something changed, but they don’t reveal where on the cell the change is occurring, or whether that change corresponds to localized swelling, contact loss, delamination, or a thermally driven increase in resistance. Without spatial context, these early indicators remain invisible. This is where spatial mapping becomes a game-changer – it provides the resolution needed to distinguish expected variation from early signs of failure.
How spatial pressure + temperature mapping helps 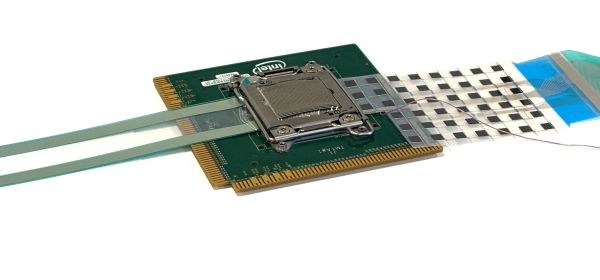 Overlaying Tekscan pressure and temperature sensors helps reveal early failure indicators that might otherwise be missed
With our I-Scan platform, one can place a pressure-sensitive array across the cell face or module interface and simultaneously capture a spatial map of temperature using a temperature mapping sensor.
This provides:
- A baseline footprint of pressure across the cell under nominal operation (pre-aging, normal state).
- Detection of localized pressure anomalies: for example, a region where pressure drops suddenly compared to the baseline, or where pressure is significantly higher than adjacent zones, potentially indicating swelling, gas generation, or stack deformation.
- A correlated temperature map allowing you to see whether a pressure anomaly coincides with a temperature rise or gradient in the same spatial domain. For example: a region of higher pressure may correlate with poor heat removal and a slight hotspot; or a region of lower pressure may correspond to loss of contact and a hotter region due to increased thermal resistance.
- A time-series view across cycling or aging: by mapping both pressure and temperature over multiple cycles or aging events, you can see when the deviation emerges, where it is, and how it evolves, giving early warning of a mechanical failure mode before it becomes catastrophic.
Example Scenario
Imagine you are cycling a pouch cell inside a module. Initially the pressure map is uniform across the cell face. After 300 cycles, the pressure map now shows one corner dropping by ~8% while the remainder of the cell remains constant. Simultaneously, the temperature map shows a ~4°C rise in that corner during peak load. Individually, these changes might look insignificant. Together, they point to a localized loss of contact or slight delamination at that corner. Without mapping, you might only see a tiny average pressure drop and a slight average temperature rise (and the changes might be within spec) and miss the root‐cause location.
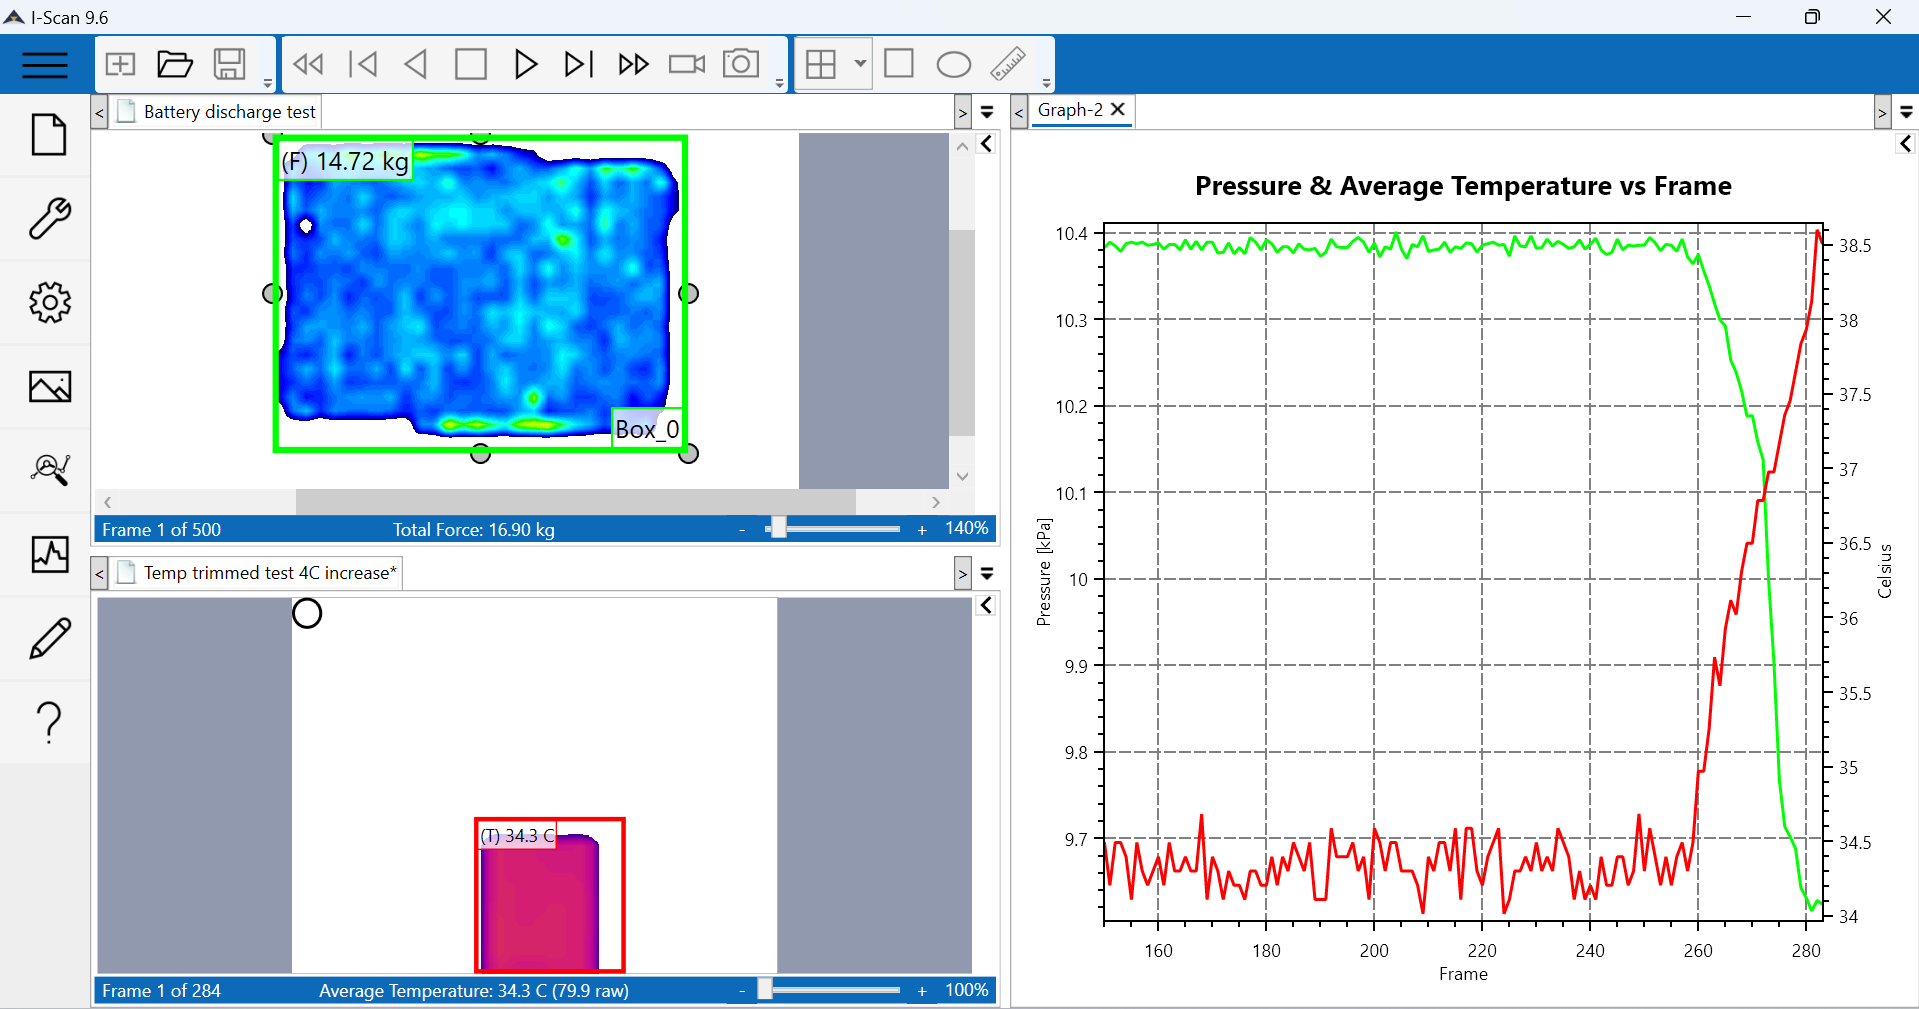 Spatial maps show an 8% pressure drop and 4C rise in the outer 5mm ring highlighting edge-zone gradients that indicate a need for clamp or thermal interface redesign
Why Tekscan is your partner in solving battery test failures
At Tekscan, we combine decades of expertise in flexible pressure arrays with our newly added temperature mapping capability, all integrated with our software and hardware chain built for traceability, high resolution, and real-time visualization.
We help you not just measure but interpret. Our team supports:
- mapping setup
- baseline definition
- anomaly detection thresholds
- integration with your manufacturing/validation flow
By adopting both spatial pressure and temperature mapping early in your production/validation process, you’re better positioned to catch early failure modes, reduce scrap, improve pack reliability, and shorten validation cycles.
Next Steps:
Want to integrate pressure + temperature mapping into your validation line? Contact us. Our engineers can help configure baselines, map geometry, and set tailored anomaly alerts.