
How Noise is Mitigated When Mapping Pressure and Temperature Together
Getting reliable data: how to separate signal from noise when measuring pressure + temperature.
Spatial mapping of pressure and temperature is a powerful tool, but only if you trust the data. Real manufacturing and test environments bring noise: mechanical vibrations, thermal drift, sensor drift, EMI, pressure coupling, ambient fluctuations. In this post we explore how combining pressure mapping and temperature mapping in one platform helps you mitigate noise, and how Tekscan helps you implement best-practice measurement protocols to extract meaningful, repeatable data.
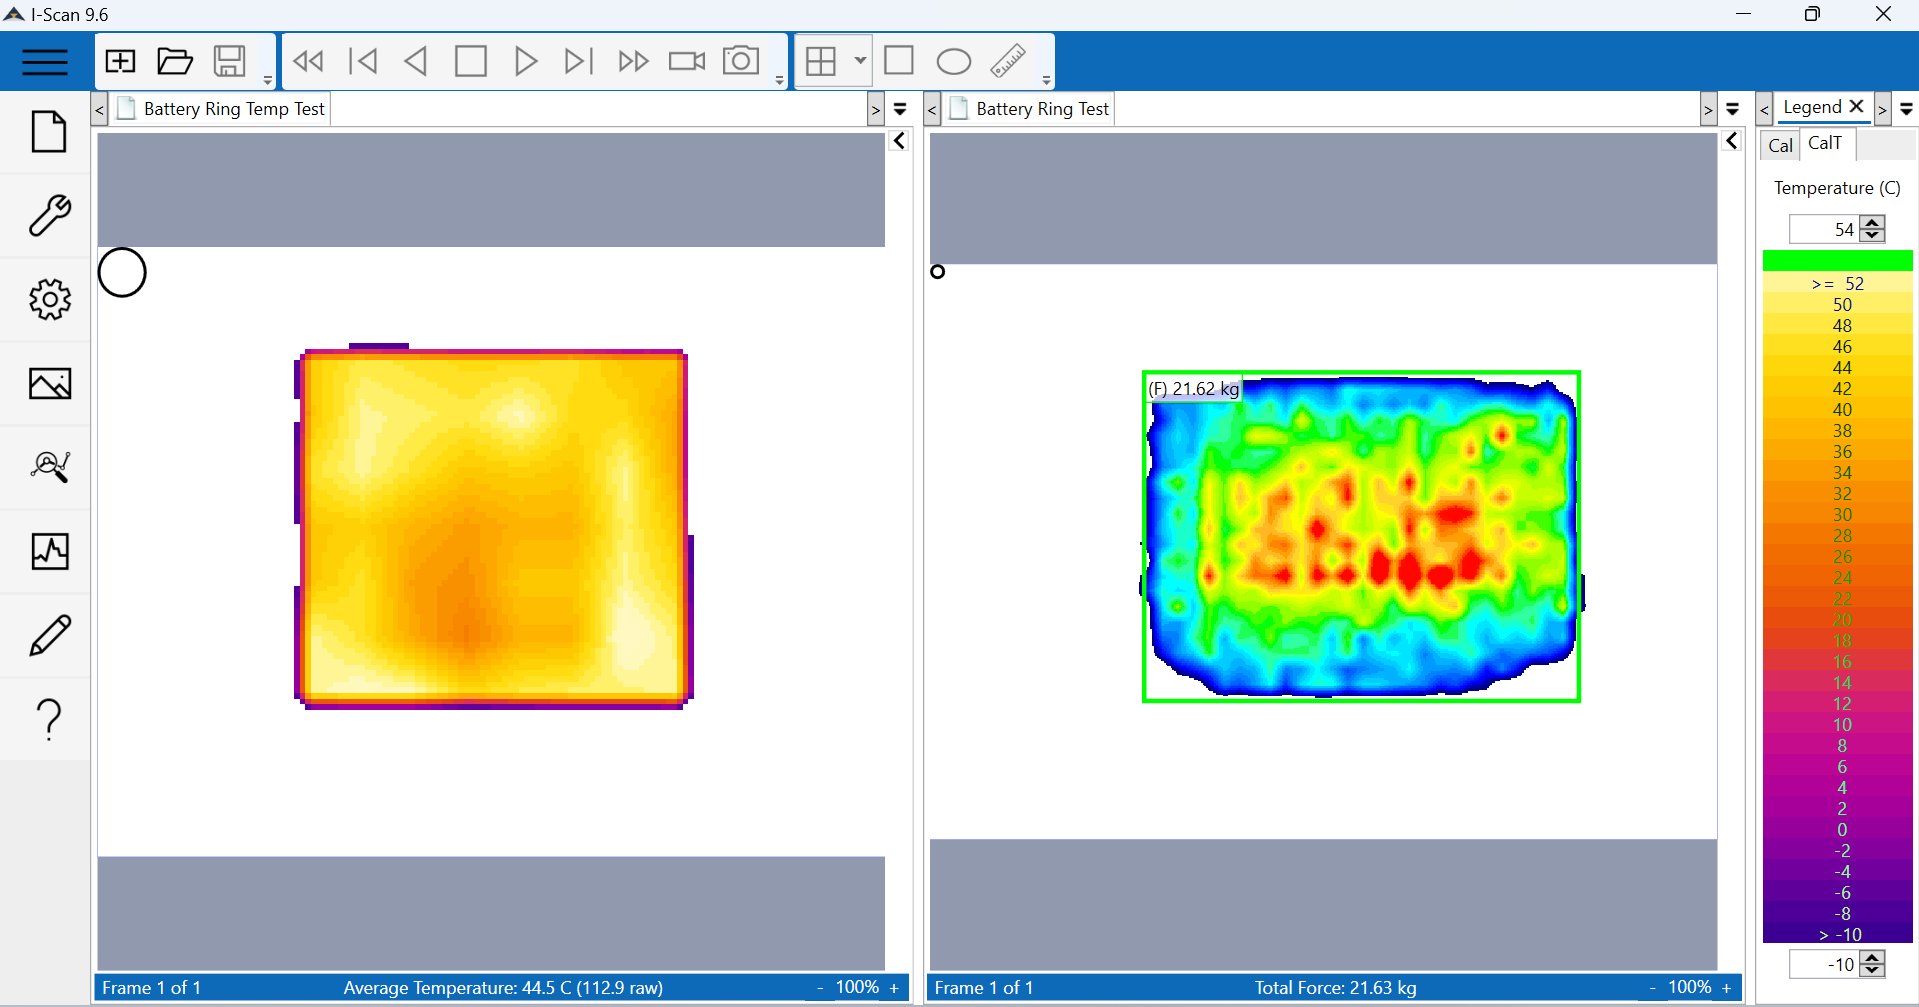 Comparing temperature and pressure in the center vs the outer ring
Understanding noise sources
In a pressure or temperature mapping system, some of the common noise contributors include:
- Mechanical vibration or movement: clamping changes, test rig instability, module expansion/contraction during cycles.
- Thermal drift: ambient temperature changes, pre-heat effects, cooldown phases, heat sinking shifts.
- Electrical interference/EMI: nearby switching power supplies, high-current busbars, cycling loads.
- Thermal-mechanical coupling: e.g., pressure change causes temperature change; temperature change causes material expansion altering pressure.
If these sources are not addressed, what you map may show artifacts — “false positives” or masked real events — making it harder to interpret your results.
Why dual-mapping (pressure + temperature) helps
Having both spatial pressure and temperature data together provides several advantages:
- Cross-validation: If you see a localized pressure anomaly but the temperature map shows no corresponding deviation (or vice versa), you know to question whether the change is real or a noise artefact. For example, a mechanical clamp shift might change pressure but not change temperature; conversely a temperature drift might show a hotspot without a pressure shift, you’ll want to assess both.
- Signal separation: Because temperature and pressure magnitudes often evolve differently over time (pressure deviations may appear slowly; thermal drifts may show faster patterns), combining both lets you differentiate between mechanical events vs thermal artifacts.
- Baseline correction: You can build baseline maps for both pressure and temperature under stable conditions, then subtract or normalize future maps. The dual-mapping system allows you to correlate how pressure baseline shifts with temperature drift and adjust accordingly.
- Improved filtering and algorithmic detection: Our software includes built-in algorithms that use the two data channels to detect genuine anomalies: for example, a region with pressure drop + temperature rise is flagged for investigation; a region where only one channel changes slightly may be flagged as likely noise.
Practical tips for noise mitigation
Here are some best-practice steps we recommend to our customers when deploying mapping systems:
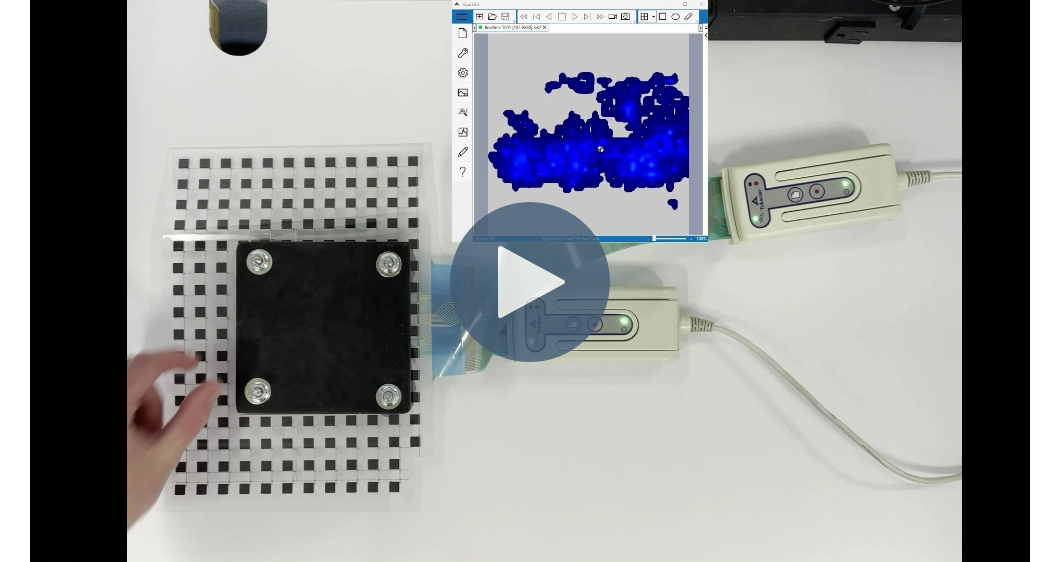
- Stabilize mechanical setup: As shown in the video above, ensure the sensor arrays (pressure and temperature) are firmly and repeatably mounted, with minimal movement or slipping during cycling. Reference plates or fixtures help.
- Thermal equilibrium: Before measurement starts, allow the cell or module to reach steady state: without large ambient temperature swings and without large transient loads. Collect a baseline map.
- Synchronized acquisition: Use a single data-acquisition sequence for both pressure and temperature to eliminate time-offsets. In our Tekscan solution this is built in.
- Ambient logging: Use an ambient reference sensor (both pressure and temperature) to track environmental drift; subtract that from your mapped data or include it in your analysis.
- Data filtering/algorithmic tools: Utilize Tekscan’s software features that apply filtering (e.g., spatial smoothing of neighboring points) to reduce false alarms.
- Repeatability checks: Run repeat cycles or replicate specimens, compare maps, and focus on differences (delta maps) rather than absolute values.
Why Tekscan’s solution is built for low-noise mapping
Tekscan’s hardware and software was designed from the ground up with dual-modality mapping in mind. Key features include:
- High-resolution arrays across the same geometry.
- Integrated calibration routines: temperature sensors are mapped to eliminate drift; pressure arrays are individually characterized under known loads.
- Synchronous data capture with matched time stamps.
- Software tools that overlay pressure and temperature maps, compute delta maps, provide anomaly flags based on combined thresholds.
- Support for export and integration with your analytics systems (so you can apply your own filtering, machine learning or trending).
If you’re embarking on manufacturing validation, reliability testing or process diagnostics using spatial mapping, don’t settle for single-modality data. The combination of pressure + temperature gives you richer insight — and when properly configured, it also gives you cleaner, more trustworthy data. Contact the Tekscan team to review your mapping setup and we’ll help ensure you’re optimized for low-noise, high-confidence measurement.