
Edge Effects: Insights Achieved by Capturing Pressure and Temperature Gradients at Battery Cell Edges
The edges of battery cells are often where the story begins.
In battery manufacturing and module integration, one of the often-overlooked aspects is the edge region of a cell, where tabs, welds, adhesives, frames, or busbars join the cell body. In many failure cases or design optimizations, variations in pressure and temperature tend to concentrate around the edges. With our spatial pressure and temperature mapping platform, one can gain insights from not just the center of the cell, but the boundary zones as well.
Why edges matter
Edge areas can be mechanically and thermally stressed zones for a few reasons:
- Mechanical clamping or module frames often apply force near the edges, which can lead to non-uniform pressure distribution toward the corners or edges of the cell.
- The tabs/welds/busbars that exit the cell are usually located near or at the cell edge; these introduce structural discontinuities, which may influence pressure distribution and thermal pathways (higher thermal resistance, hotspot risk).
- Cooling or heat rejection systems may be more effective in the center than at the edge, so temperature gradients can develop toward the periphery of the cell.
- Swelling or deformation (from cycling, gas generation, thermal exposure) often manifests at the edge first, where mechanical constraints are weaker.
Because of these factors, gradient phenomena (pressure dropping or increasing toward the edge; temperature rising toward the edge) become early indicators of emerging issues, whether design inefficiencies, assembly misalignment, or incipient failure.
What spatial mapping reveals
By deploying both pressure and temperature sensor arrays you can:
- Quantify the pressure gradient from center to edge (e.g., “pressure drops ~X % from center to outer 10 mm ring”).
- Map the temperature gradient from center to edge under load (e.g., “outer edge shows a +1.5 °C higher temperature after 20 min at 2 °C rate”).
- Overlay the two maps to correlate regions of pressure deviation with temperature anomalies (for example: a lower pressure zone near the edge shows a higher temperature because of compromised contact or cooling).
- Monitor how those gradients evolve over time or after specific events (e.g., after 500 cycles, after a thermal soak, after a sudden shock).
Interpreting Edge Gradients in Cells & Modules
| Observed Edge Behavior | Likely Interpretation |
|---|---|
| 0-5% pressure drop vs. center | ✅ Normal frame compliance / benign setting |
| 5-10% pressure drop | ⚠️ Potential early mechanical relaxation or minor misalignment |
| >10% pressure drop | ❌ Possible swelling, gas generation, or clamping imbalance |
| +1°C edge temperature | ✅ Expected boundary inefficiency |
| +2-3°C edge temperature | ⚠️ Reduced cooling efficiency or mild contact loss |
| Local hotspot near tab/weld | ⚠️ Tab resistance, over tensioning, or structural discontinuity |
| Pressure rise at edge | ❌ Frame overtightening or adhesive stiffening |
Application Example: Design Validation
Consider a module where the cell packing is very tight and frames clamp at the edges. Using our mapping platform, you discover that the pressure at the outermost 5 mm of the cell is ~18% lower than the central area. Simultaneously, temperature mapping shows that this outer ring is running ~4 °C warmer under the same load. This insight prompts a design change: either adjust clamp distribution or add a thermal interface at the edge to even out pressure and improve heat rejection — reducing risk of localized degradation.
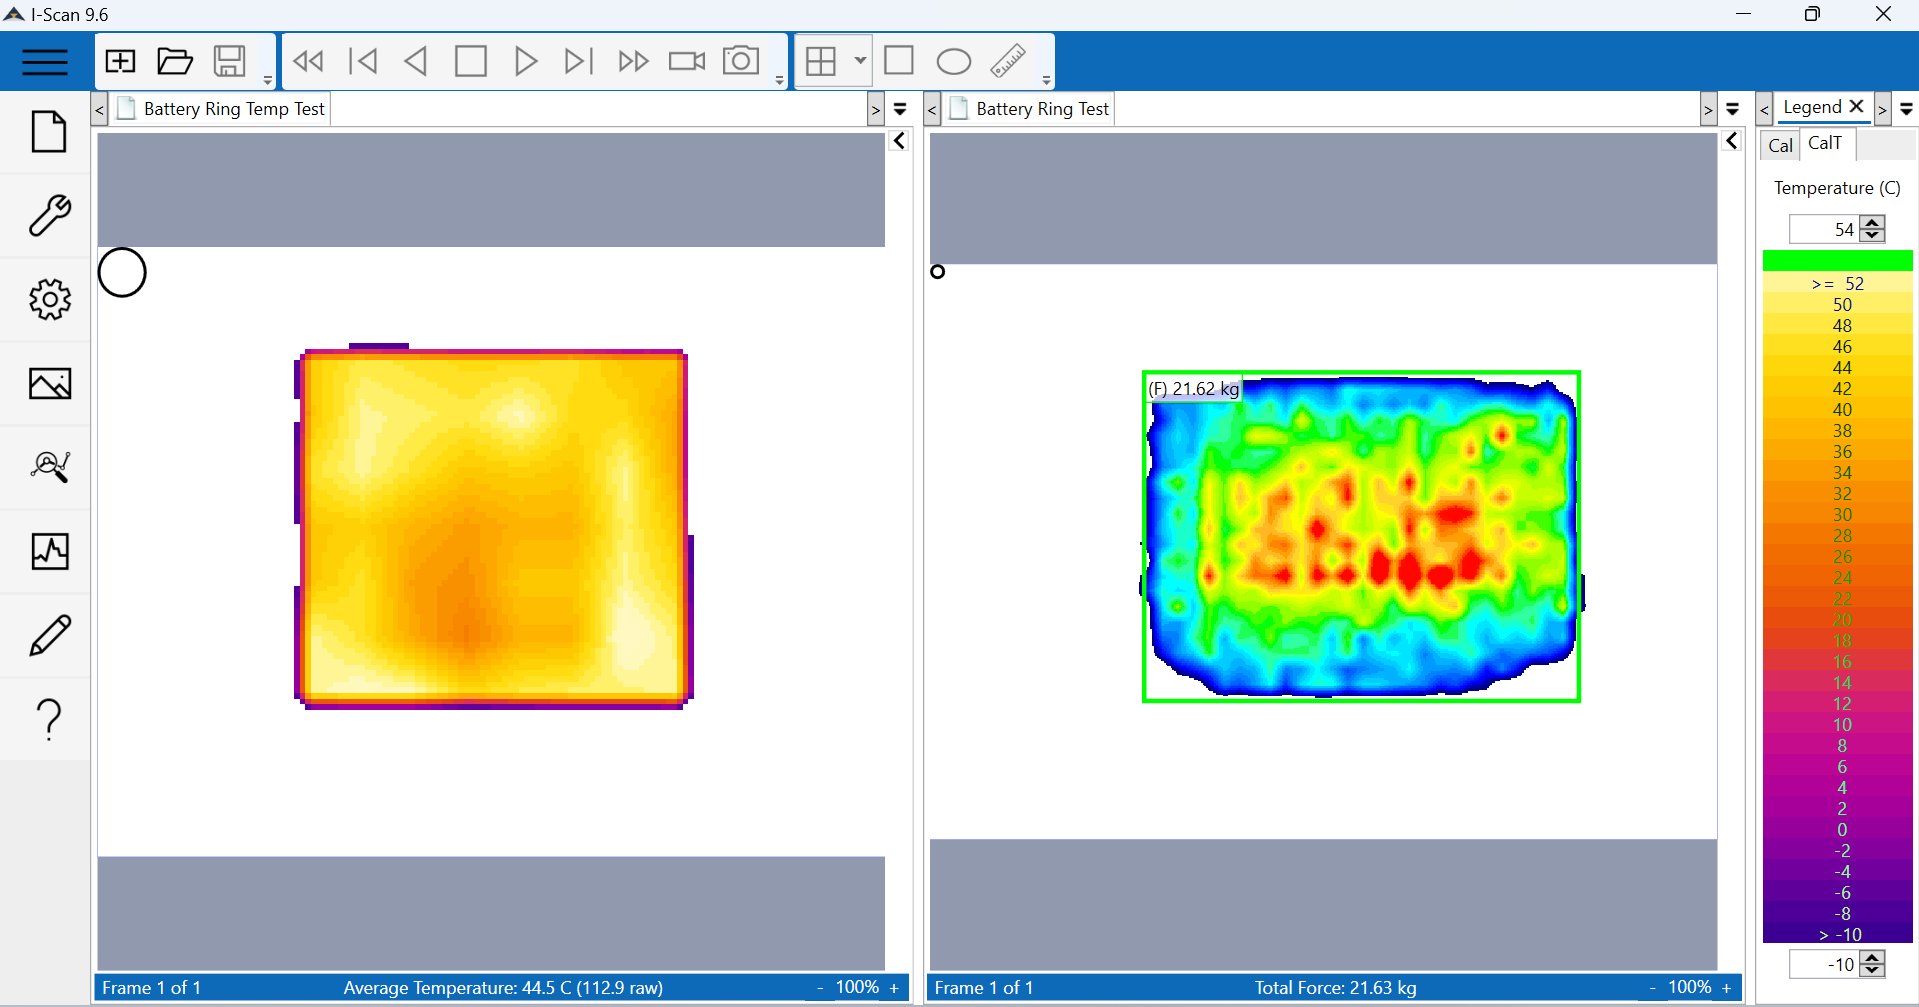 Comparing temperature and pressure in the center vs the outer ring
Application Example: Root-cause of Failure
In another case, a manufacturer sees intermittent battery module degradation. Using spatial mapping, they observe that one module exhibits a localized high-pressure zone near the tab exit (edge region), coupled with a +3 °C hotspot compared to the rest of the face. The cause: a frame bolt overtightened at that corner, squeezing the tab region and reducing thermal conduction. Because the edge region was mapped, the issue could be corrected before full scale failure or repeat scrap.
Why Tekscan’s integrated solution makes a difference
Our system was developed with edge mapping in mind: flexible sensor arrays that conform to the cell outline, software that allows custom region-of-interest (including “outer ring” or “tab zone”), and synchronized pressure plus temperature acquisition. Our team will help you define edge-zone metrics (e.g., “outer 10 mm minimum pressure 90% of center average”, “edge temperature delta ≤ 1.5 °C under X kW load”) and build those into your test protocols. This gives you both design optimization insight and manufacturing quality assurance coverage.
Are you seeing unexpected performance drift or early failure in the edge region of your battery cells or modules? Let’s connect and run a demo of our mapping platform on your geometry. Together we can optimize your clamping, cooling, and manufacturing process so that edge-zone behavior is no longer a blind spot.
Next Steps:
Want to integrate pressure + temperature mapping into your validation line? Contact us. Our engineers can help configure baselines, map geometry, and set tailored anomaly alerts.