
Mapping the Pressure Impacts of Water and Waves on High-Speed Boats
 Some drivers (and passengers) simply have an insatiable need for speed. Many people get a thrill out of pushing a vehicle to its limits, no matter the dangers involved. Naturally, design engineers of these vehicles need to take all kind of drivers into account, as well as the risks that different driving surfaces can also pose to the vehicle and its passengers.
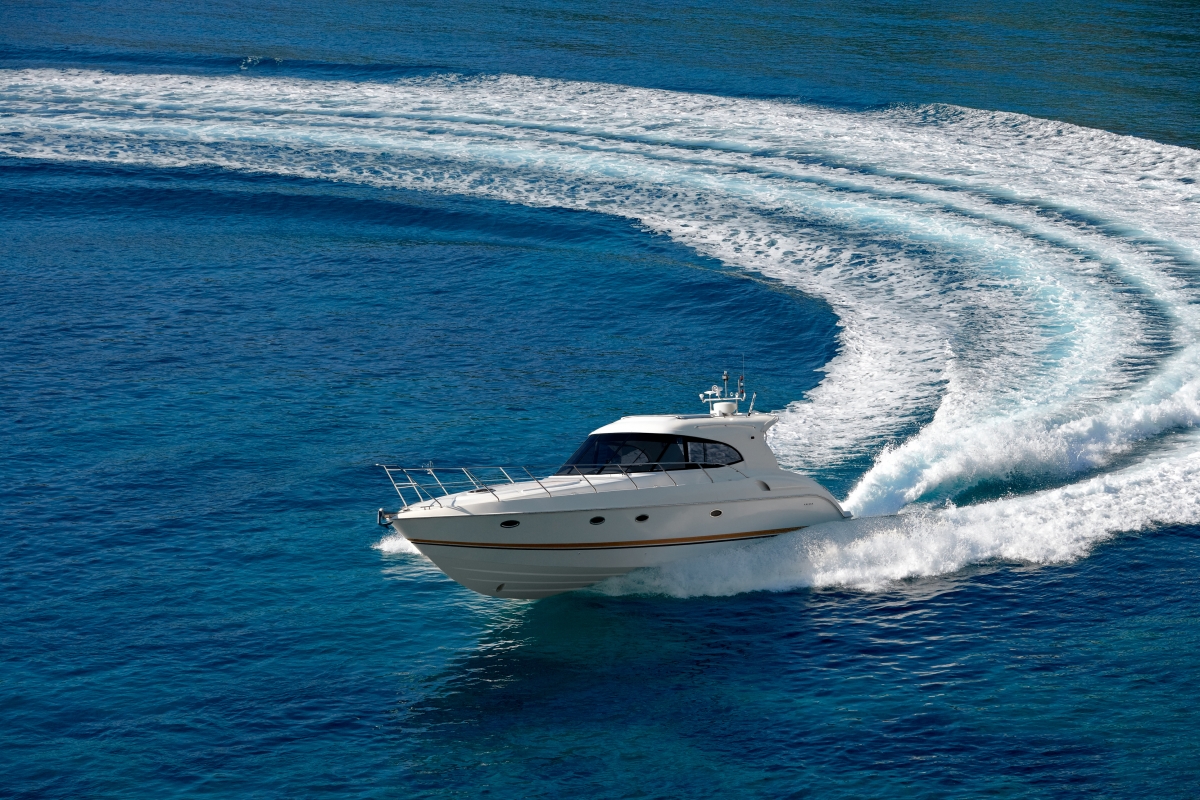
For designers of speed boats, jet skis, and other water recreational vehicles, predicting the impacts of waves while traveling at high speeds is not a clear-cut science. Even in calm waters, as these high-speed crafts accelerate across the water, they lift upward and become periodically airborne, smashing into the water repeatedly until the craft slows down.
In the past research, single-cell point pressure sensors positioned on the craft’s hull have been used to measure impact force of waves in different types of durability tests. However, these sensing technologies do not provide the complete array of pressure distribution felt across a specific area of the craft.
Recently, a group of researchers from the United States Naval Academy Department of Naval Architecture and Ocean Engineering1 set out to study the fundamental physics of water impacts on high-speed planing hulls, and to measure the slamming loads as the ship would speed across the water. By gathering high speed and temporal resolution on the rigid body motions, impact pressures, and water surface during each impact, the fundamental physics involved during a wave slam can be investigated.
| Full Scale Hull | Model | |
| Length Overall m (ft) | 13.0 (42.8) | 1.2 (4) |
| Max Beam, m (ft) | 4.0 (13.1) | 0.37 (1.2) |
| Displacement, metric tons (lbs) | 15.9 (35,000) | 0.013 (27.9) |
| LCG (fwd of transom), m (ft) | 4.6 (15.1) | 0.43 (0.45) |
| KG (above baseline), m (ft) | 1.5 (4.8) | 0.14 (0.45) |
This model ship was instrumented with traditional single-point pressure sensors on one side of the hull, as well as a high-speed I-Scan™ pressure mapping system on the other side, to capture data for comparison. The sensors were positioned toward the middle of the hull (long center of gravity, or, LCG).
Figure 1 shows the representative image of the of the I-Scan sensor compared against two different single-point sensors (indicated as P52 and P43) at three specific moments in time, milliseconds from one another, during a single wave impact.
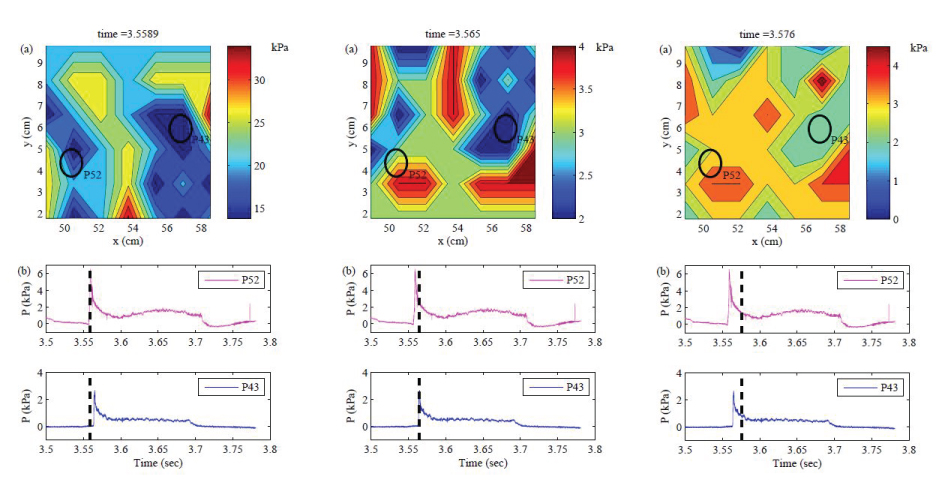 Figure 1: The representative pressure mapping image shows a close correlation to the impact data captured by the single-point pressure sensors (P52 and P43), providing a clearer picture of pressure distribution in a high-speed wave slamming test. Time 3.565 was the apex of the wave slam event.
Based on these findings, the researchers determined that the high-speed pressure mapping system could effectively illustrate the wave slamming impact event on the scale model since it closely aligns with the instantaneous impact data captured by the single-point sensors.
Manufacturers of high-speed boats can better understand and address the impacts of waves in specific spots of their ship designs by employing high-speed pressure mapping technology during their design evaluation. This can go a long way in creating sturdier hulls and safer crafts, as the industry strives to meet the diverse consumer demands.
Interested in Learning More about Pressure Mapping’s Role in Advancing Transportation Vehicles and Infrastructures? Click Here to Download this Free eBook Today!
![]()