
Case Study: A Comparison of Wireless Pressure Mapping Configurations in a Drop-Test Experiment
Pressure mapping systems capture and record interface pressure exchanges in real-time. Each pressure mapping system is comprised of three components: a thin, minimally invasive sensor, scanning electronics, and software. In standard configurations, the scanning electronics connect via USB to a PC or Windows® tablet.
While this tethered configuration may be acceptable for many applications, it may cause a challenge for others, including:
- Dangerous testing environments
- Testing environments with space limitations
- Testing environments that are in motion (including high speeds)
Given these demands, Tekscan developed three different wireless pressure mapping configurations:
There are a few factors to consider when choosing among these options, including:
- Scan speed
- Size & mass of equipment
- Weight limitations
-
The need for real-time feedback
- This may not always be critical to the application, but it can impact productivity you are running multiple tests over time.
Here's how Tekscan's Wireless Pressure Mapping Configurations Compare:
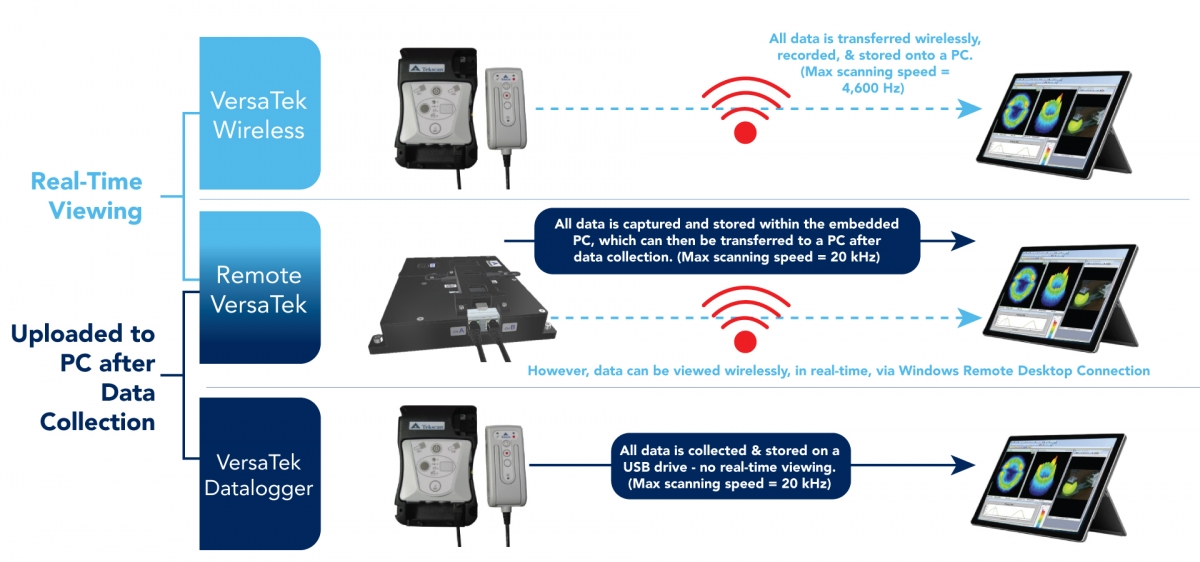
As you can see, each of these options offer benefits and limitations in terms of scanning speed and the ability to review data in real-time. Depending on the needs of your application, one configuration may serve your needs better than others.
However, to give you a better look into the capabilities of these wireless configurations, we conducted a simple drop-test experiment.
Experiment Summary:
|
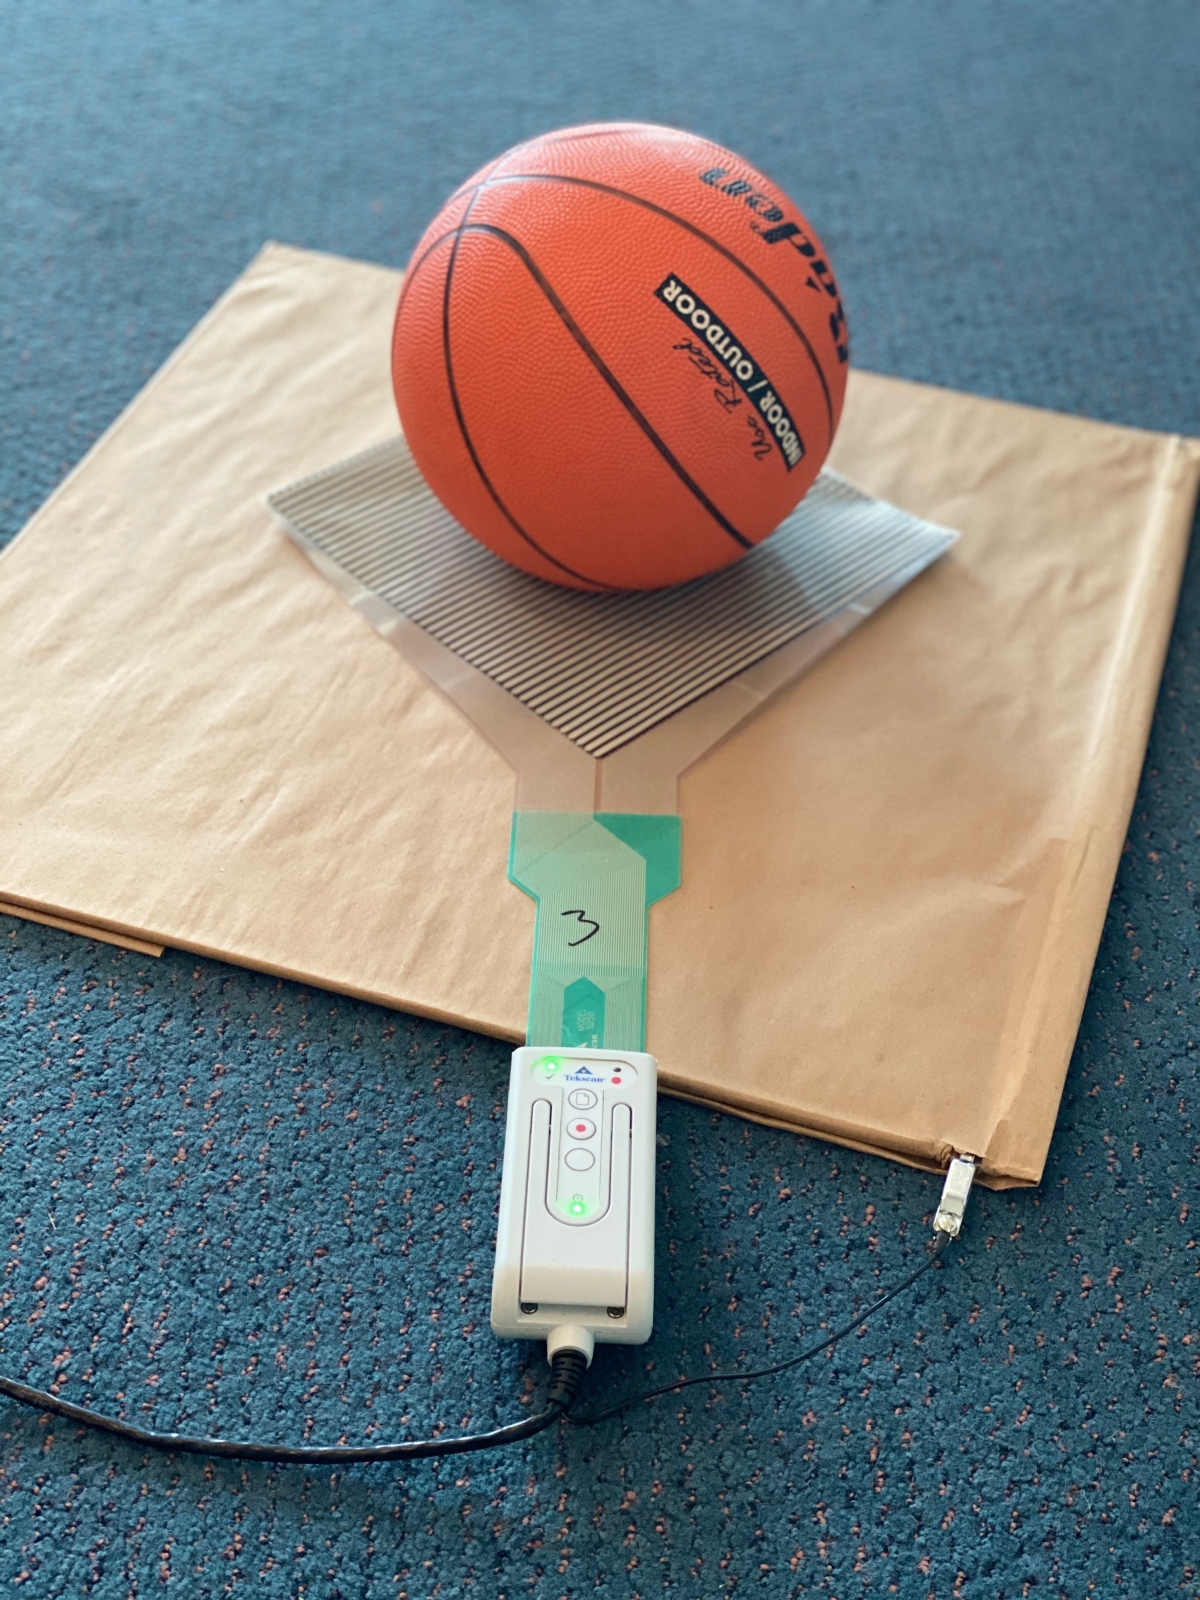 Figure 1: Image of the water-filled basketball, scanning electronics, and 5250 pressure mapping sensor used in the drop-test experiment. Figure 1: Image of the water-filled basketball, scanning electronics, and 5250 pressure mapping sensor used in the drop-test experiment.
|
Hypothesis
Because the object was filled with water, we were expecting to see some effect of the liquid flowing through the basketball as it made contact with the sensor. This level of pressure detail would be an indicator on whether the specific wireless configuration could be more useful for a high-speed impact applications requiring more pressure detail.
Results
VersaTek Wireless (VTW)
- To begin, the VTW unit was connected to a laptop PC via a local network that was being broadcasted from an external wireless hub (included with purchase).
- The operator configured the VTW to trigger upon contact from the basketball.
- With the VTW armed, the operator dropped the basketball onto the sensor, then stopped the recording for analysis
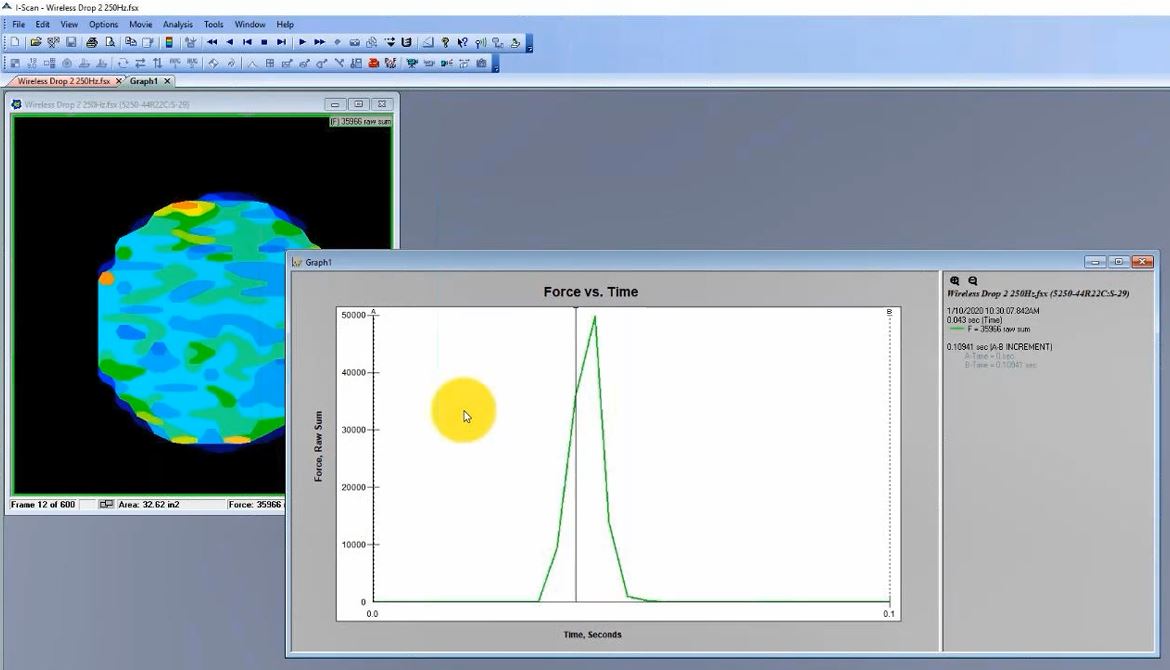 Figure 2: Pressure output from the VersaTek Wireless (VTW) drop test.
As shown in Figure 2, the operator focused on the first bounce from the basketball to evaluate the quality of data. You may notice that the green curve has a jagged, pointy curve. This is because the scanning the maximum scanning speed of the configuration with the 5250 sensor was only 257 Hz.
VersaTek Datalogger (VTD)
- The VersaTek hub is connected to the PC for configuration
- Because some VersaTek Wireless units can be configured for both Wireless and Datalogger data capture, the operator switched the mode from Wireless to Datalogger, then reopened the I-Scan software.
- Also, because the VTD can scan at a much faster rate than the VTW, the operator was able to set the acquisition parameters to 1.4 kHz.
- The operator set a recording time duration of 10 seconds.
- With the configurations in place, and the sensor connected to the VTD unit, the operator triggered the unit to begin recording when the ball makes contact with the sensor.
- After the drop test was completed, the operator removed the SD card from the VTD unit, and inserted it into the laptop PC.
- Finally, the operator opened the recording file in the I-Scan software for analysis
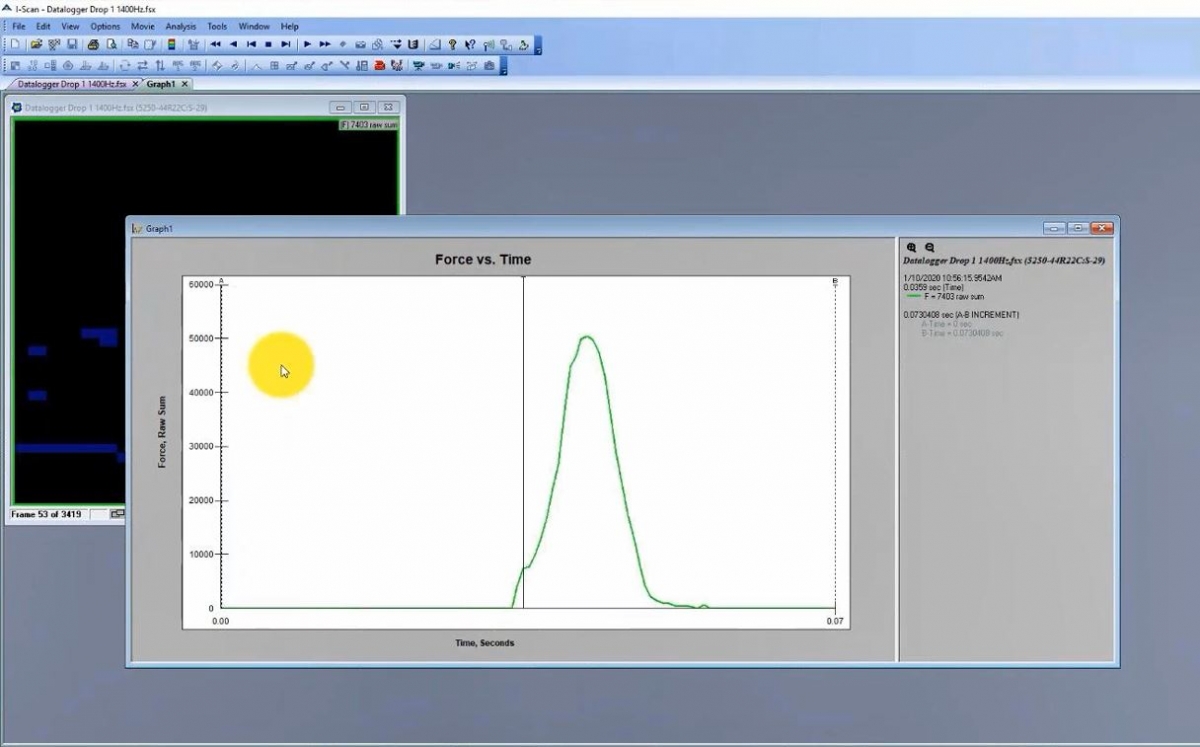 Figure 3: Pressure output from the VersaTek Datalogger (VTD) drop test.
As shown in Figure 3, the faster scanning speed of the VTD was able to display the impact data in greater detail than the VTW. However, given the number of steps required to configure, arm, capture, and analyze the data, using the VTD took a lot more time and effort than the VTW.
Additionally, the operator must physically push the button on the hub to arm the system. This can be very time consuming in a dynamic application that needs to be stopped and started for each test.
Remote VersaTek (RVT)
-
First, the operator synchronized the laptop PC with the ComputeStick (aka, “TekStick”) embedded into the RVT unit. To do this, the operator opens the “Remote Desktop Connection” option on their PC, and enters the unique TekStick IP address (included with purchase of the RVT unit)
- Note: The operator will only have to enter the IP address onto a single computer once, as it will remember the connection each time the RVT unit is used with the same PC.
- After connecting remotely to the RTV, the operator opens the I-Scan software (pre-loaded onto the RVT device) to begin recording
- Much like the VTD, the RVT can scan at the maximum scanning speed (1.4 kHz)
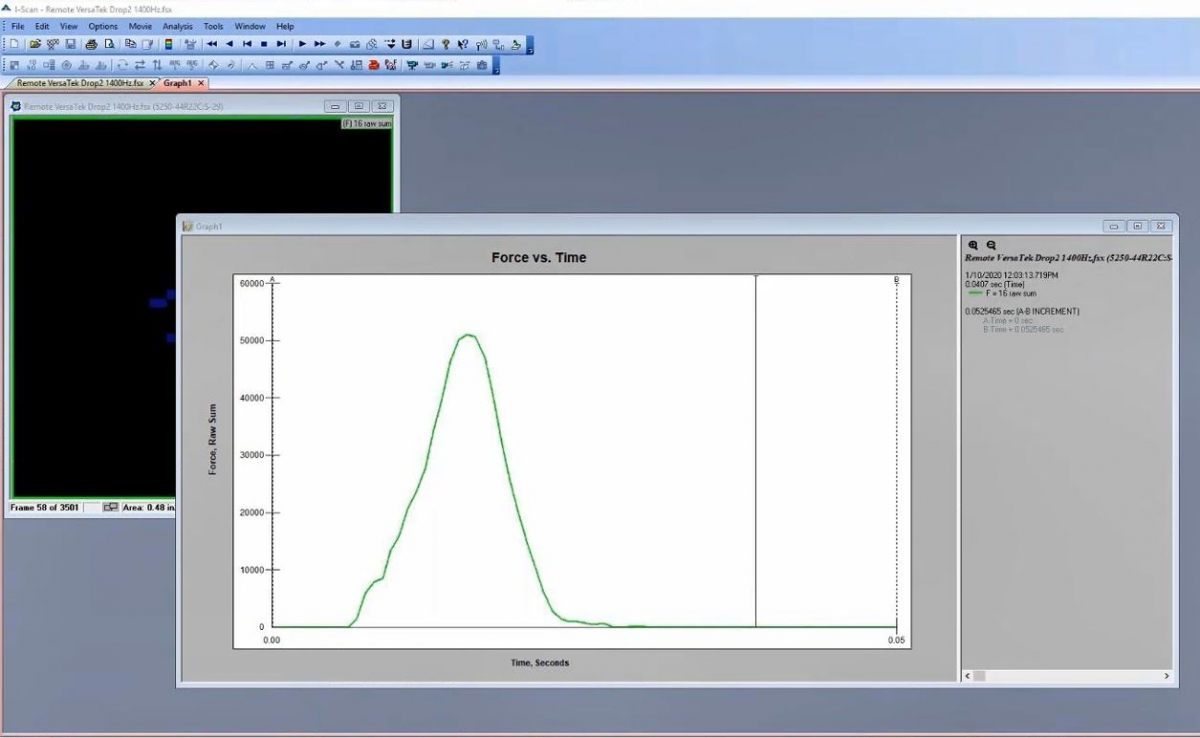 Figure 4: Pressure output from the Remote VersaTek (RVT) drop test.As shown in Figure 4, the RVT pressure data shared a very similar curve compared to the VTD, and required far fewer steps to capture the data.
Conclusion
This simple drop-test experiment showed that VTD and RVT captured a better degree of pressure detail and resolution compared to the VTW. When you consider other high-speed applications (for example, crash tests, high-speed tire footprint analysis, pick & place manufacturing, and more), this level of data quality may be crucial to your experiment.
However, because the VTD required significantly more steps execute the test – which could become cumbersome for any experiment requiring repeat testing – we can conclude that the RVT offers the best experience for both quality of data, and ease-of-use. However, the other two options could be considered if a smaller form factor is needed.
|
Interested in more context on this experiment? Download our on-demand webinar here: |