 Skip to main content


Battery Pressure Measurement: 2026 Insights Inform 2027 Testing
As battery technologies continue to evolve, engineers are looking for more insight into what occurs inside a cell during charging, discharging, and long-term cycling. While supporting our battery engineer customers, several measurement approaches emerged as key areas of focus for improving battery analysis, including pressure distribution mapping, temperature correlation, and long-duration testing.
Trend #1: Moving Beyond Average Force Measurements
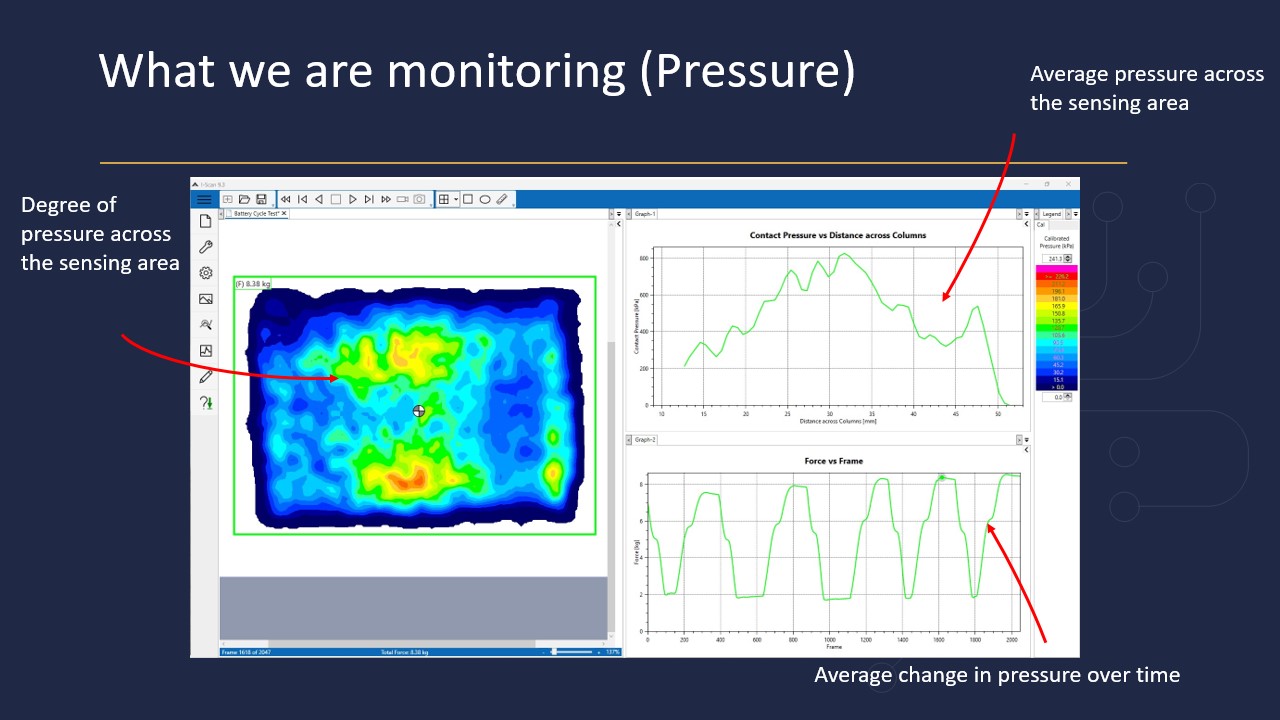
In working with battery engineers, we've talked through the limitation of relying solely on average force measurements. While average force can indicate that pressure changes are occurring during a battery cycle, it may not reveal where those changes are happening or what is causing them. Localized swelling, contact loss, delamination, and increased resistance can become obscured when measurements are reduced to a single value.
As a result, engineers are increasingly interested in pressure distribution data that provides visibility across the entire battery surface rather than at a single measurement point.
Trend #2: Greater Emphasis on Spatial Pressure Distribution
Research data compares traditional load-cell measurements with spatial pressure mapping approaches. While load cells provided insight into overall stack pressure, pressure distribution measurements enabled researchers to identify localized peak-pressure regions across the cell. Researchers observed1 that cells exhibiting extreme localized pressure concentrations degraded faster than cells with more uniform pressure distributions.
This shift from measuring pressure to understanding pressure distribution continues to expand the amount of information available during battery testing.
Trend #3: Correlating Mechanical and Thermal Behavior
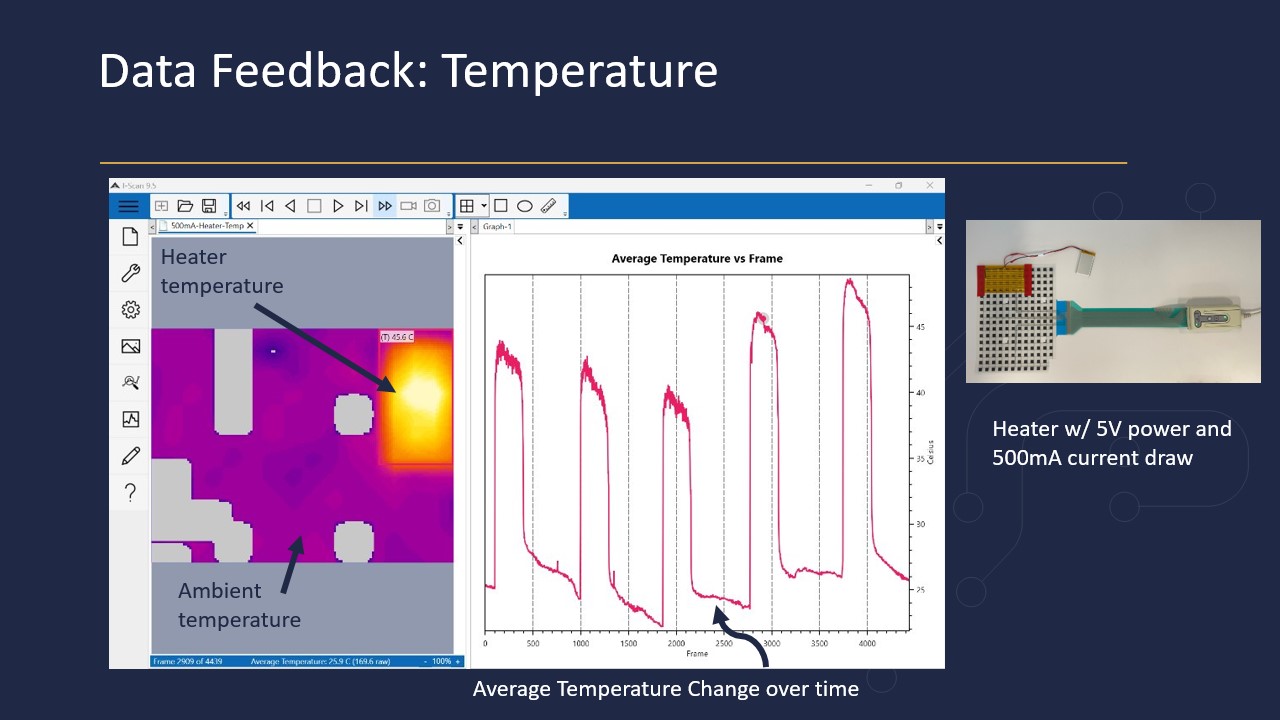
Another is the value of examining pressure and temperature together.
We've seen and demonstrated examples where changes in pressure occurred alongside temperature variations during charging and discharging cycles. By viewing both measurements simultaneously, engineers can better investigate localized conditions that may otherwise remain hidden when examining either dataset independently.
The ability to correlate mechanical and thermal behavior can better understand phenomena such as contact loss, delamination, and localized battery stress conditions.
Trend #4: Increased Focus on Identifying Localized Failure Indicators
Several battery conditions may emerge during cycling, including swelling, gas-induced deformation, connector loosening, delamination, and potential internal shorts. Many of these issues begin as localized events before becoming visible through average measurements.
For engineers, this creates a growing need for measurement approaches capable of detecting changes at specific locations within the cell rather than only monitoring overall force changes.
Trend #5: Closer Attention to Cell Edges and Critical Regions
We've noticed the importance of edge effects in battery analysis. Mechanical clamping, tabs, connector frames, cooling effectiveness, and structural constraints can all create pressure and temperature differences near the perimeter of a battery cell.
Examples show how pressure and temperature mapping can reveal localized conditions near cell edges that may influence overall battery performance and degradation behavior.
Trend #6: Long-Duration Measurement and Data Correlation
As battery testing extends across hundreds of charge-discharge cycles, maintaining confidence in collected data becomes increasingly important. We've identified approaches for managing sensor drift and described methods for correlating pressure measurements with additional data sources, including load cells, voltage measurements, current measurements, and external analog inputs.
The ability to synchronize multiple datasets helps engineers evaluate battery behavior over extended testing periods while maintaining context for observed changes.
Conclusion
Themes that continue to shape battery pressure measurement: moving beyond average force measurements, increasing the use of spatial pressure data, correlating pressure with temperature, identifying localized failure indicators, and integrating multiple measurement streams during long-term testing. Together, these approaches provide engineers with more detailed visibility into battery behavior throughout testing and validation activities.
Related Blog Posts
- Questions Engineers are Asking about Battery Pressure Measurement
- Why Pressure Data Matters During Battery Testing and Validation
- Full webinar: New Insights into Battery Behavior with Pressure and Temperature Mapping
I-Scan™ 10 is Now Available
I-Scan version 10 with the new TekDAQ 220 electronics is more than a hardware update. Designed for demanding test environments, its industrial-grade electronics provide enhanced ESD protection and improved resistance to electrical noise. New software features help engineers with enhanced data visualization.
Post Categories:
Previous Post: |