
Pro Tips to Validate Sensor Performance Before Prototyping
 Ed Haidar - Tekscan Applications Engineer Tekscan Applications Engineer Ed Haidar is back with another helpful tip to keep in mind while testing FlexiForce™ sensors.
Over the years, one of the more common questions we’ve received from customers who have tried our standard FlexiForce™ sensors is on the topic of sensor repeatability. In many cases, the user has gone through the process of conditioning and calibrating the sensor, connected it to their fixture for testing, only to find that the sensor output may have various fluctuations in the testing data, or “noise.”
You may have seen on our standard sensor data sheets that we list a <±2.5% (CoV) repeatability variation* for all of our standard sensors. This has been assembled from years of testing data, and is a number that we firmly support. However, after seeing fluctuations in the sensing data, the first reaction for most may be to think that the sensor is defective.
In reality, though, the sensor may be performing to specifications, when considering outside variables that may be affecting the testing fixture.
Here’s an example of sensor tested on a pneumatic air cylinder fixture with a 0-5V pressure controller. The fixture applied and released 44.5 N (10 lbs) of force onto a sensor, in 10-second durations, for 1 minute.
Here are the results of the fixture test on a FlexiForce sensor:
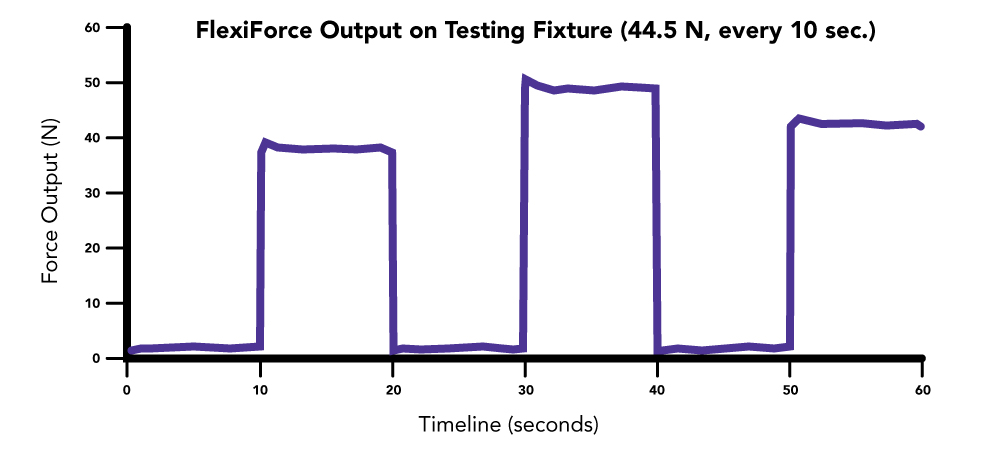
As you can see, there are some obvious variances in the force data. However, it’s clear that force ranges are noticeably inconsistent from one force application to the next, with about a <±6% repeatability variation – well over the <±2.5% listed variation.
To test the validity of this data, a load cell was used on the fixture following the same testing interval. And the results:
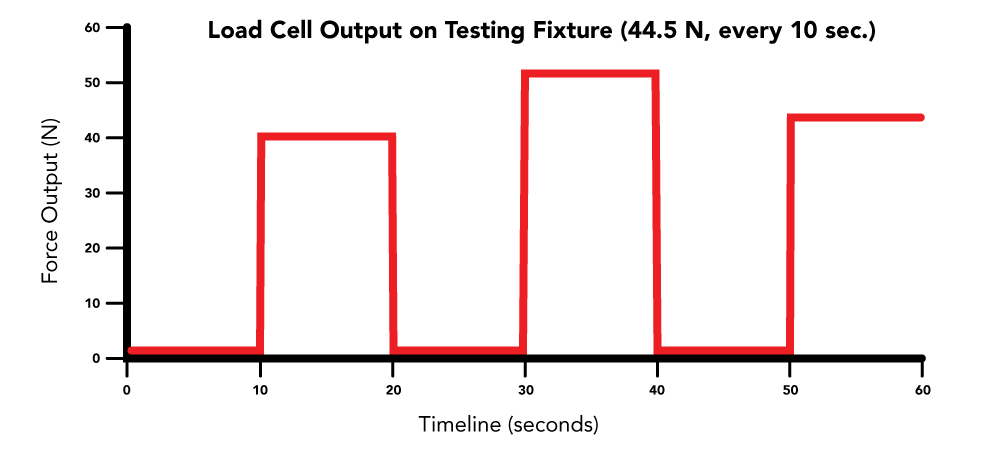
As you can see, the load cell results clearly demonstrate that the force application from the fixture may not be as consistent as perceived. This suggests that the testing fixture may need a mechanical adjustment to ensure that the exact force is applied with each application.
Also, Consider the Surrounding Operating Environment
A second test with the same testing parameters was performed on the same FlexiForce sensor. However, the data now looks quite different:
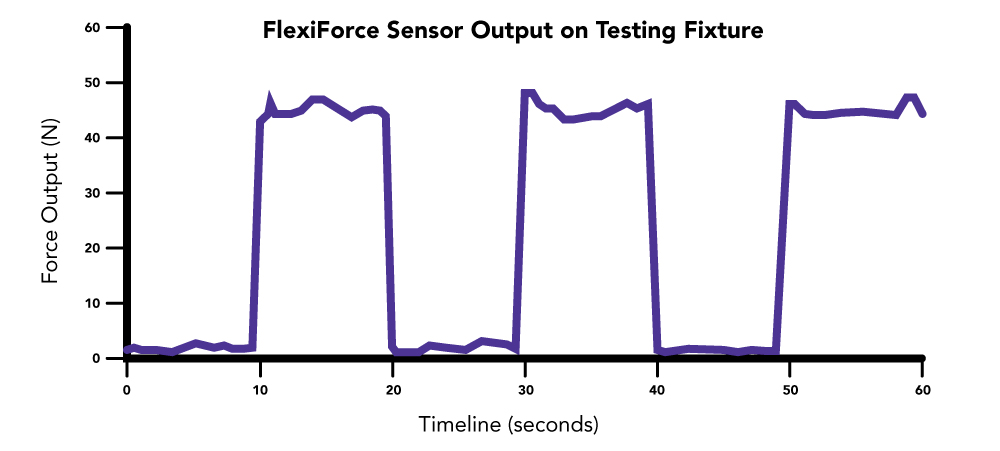
Notice the especially sharp peaks and valleys have a few uneven bumps and angles across the testing period. On the surface, this data appears rather concerning, especially when considering the controlled fixture that’s being used.
But – while this test was occuring, a Vibration Meter was also placed on the fixture to monitor any movement that occurred around the sensor. Check out this data:
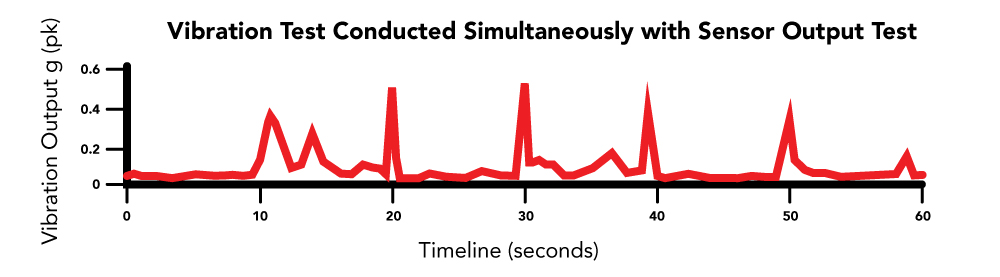
As you can see, some of those same fluctuations from the sensor data nearly match all vibration peaks and valleys from the vibration test. There is especially a lot of vibration occurring at the moment the force is being applied and removed from the sensor. Considering the testing environment, we can see that the sensor is actually maintaining very accurate repeatability within this fixture.
There are several other outside factors that can also cause the discrepancies that you see in the graphs above, including:
- Inconsistent offloading procedure
- Sensor drift and load/actuation timing
- Poor surface or contact material selection
- Extreme temperature or humidity shifts in the operating environment, and others
In many cases, new users of FlexiForce sensor look to validate sensor performance before proceeding to prototyping and embedding. This is in an effort to gain confidence in the measurements the sensor produces. While this is a great step, it is vital that the user has thoroughly characterized the performance of the loading environment and fixture they are using to validate sensor performance, otherwise, unknown variations in the loading fixture will manifest themselves in the sensor data and compromise your interpretation of the sensor data.
Because every application and testing fixture is unique, we highly recommend consulting our Best Practice Guides for Integration of a FlexiForce sensor, or contact us to discuss your testing data concerns.
Download the FlexiForce Integration Guides
Or
Click here, and let's discuss your application
*Conditioned sensor, 80% of full force applied.