Versatile Pressure Mapping System
Versatile Pressure Mapping System
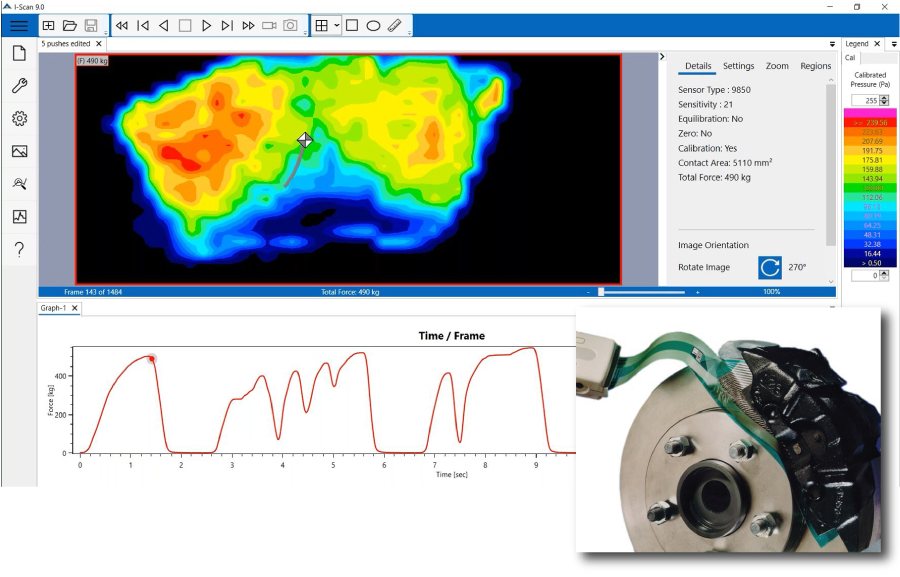
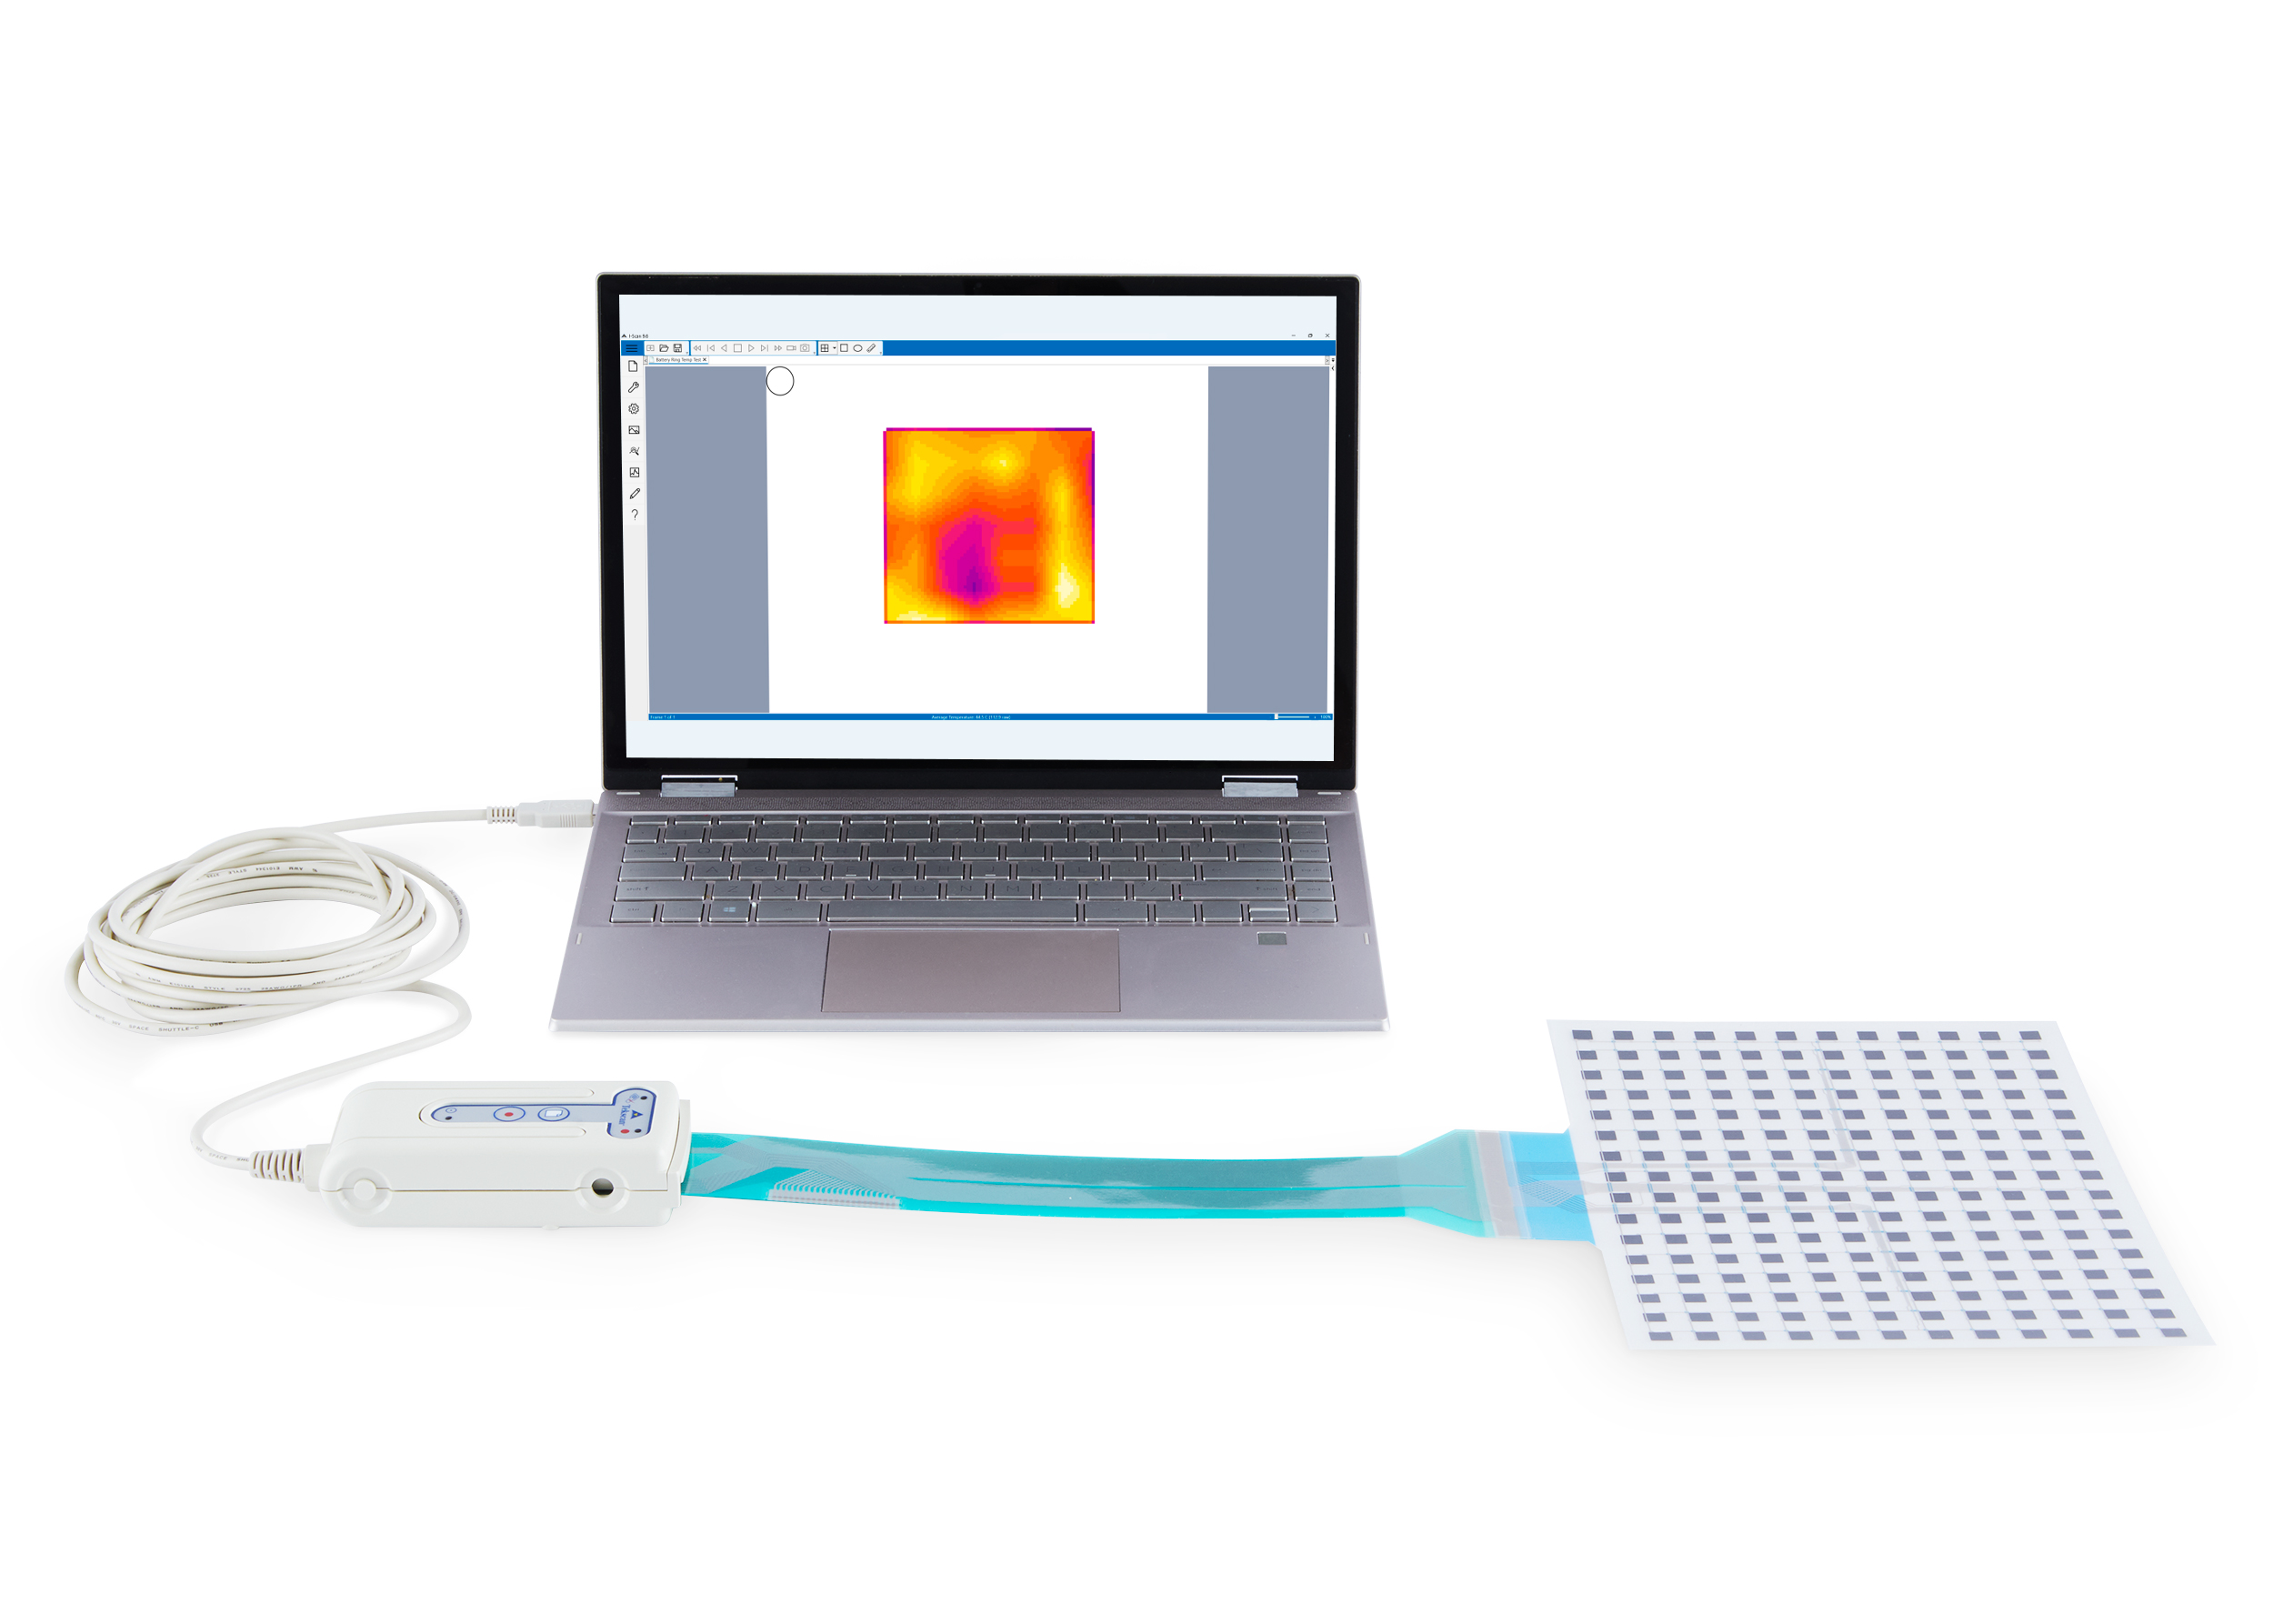
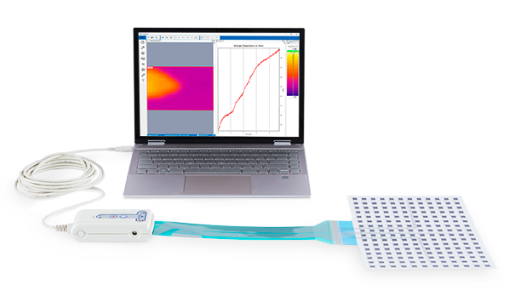
I-Scan™ is a powerful tool that accurately measures and analyzes interface pressure between two surfaces, utilizing a thin and flexible sensor. The system is comprised of data acquisition electronics, sensors, and software. Measuring both force and pressure, the exceptionally thin tactile sensor provides minimal interference between the objects being measured, allowing the true interface pressure data to be obtained. The interface pressure data collected offers vital information and insight to enhance product design, manufacturing, quality, and research.
Standard I-Scan software window displaying the pressure distribution across a brake pad and rotor.
A Foundation for Data-Driven Decisions
Accurate, repeatable pressure measurement is the foundation for better designs, faster validation, and smarter manufacturing decisions. By capturing dynamic interface pressure data with thin, flexible sensors, I-Scan provides a reliable digital record of how products and processes perform under real-world conditions. This data allows engineers and manufacturers to:
Product Design
- In-depth understanding of surface behavior
- Verify forces and peak pressures between two components
- Measure external forces
- Reduce failures & associated costs
Manufacturing
- Verify calibration of machinery
- Improve repeatability of processes
- Reduce downtime & improve yields
Quality Control
- Identify potential failure modes
- Quality inspection & control
- Competitive benchmarking
Research
- Understand the physical properties of the objects being measured
- Understand the pressure distribution between two surfaces
Features
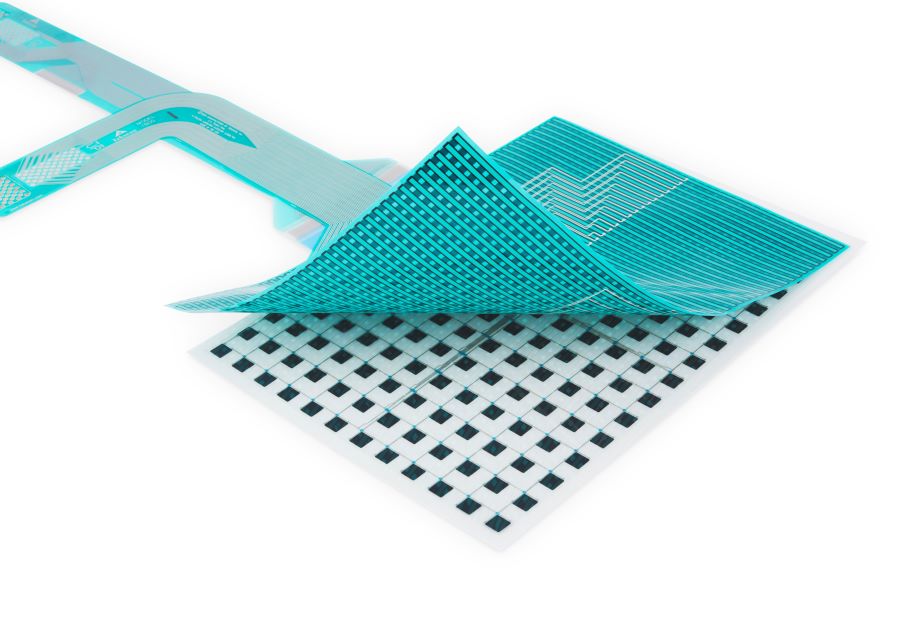
Over 200 Sensors Available
Over 200 flexible, thin film tactile pressure sensors are available in different sizes, shapes, resolutions, temperature ratings, and pressure ranges (up to 25,000 psi or 1,700 bar).
Watch this short video covering the Top-6 Most Popular I-Scan Sensors
Watch this short video covering the Top-6 Most Popular I-Scan Sensors
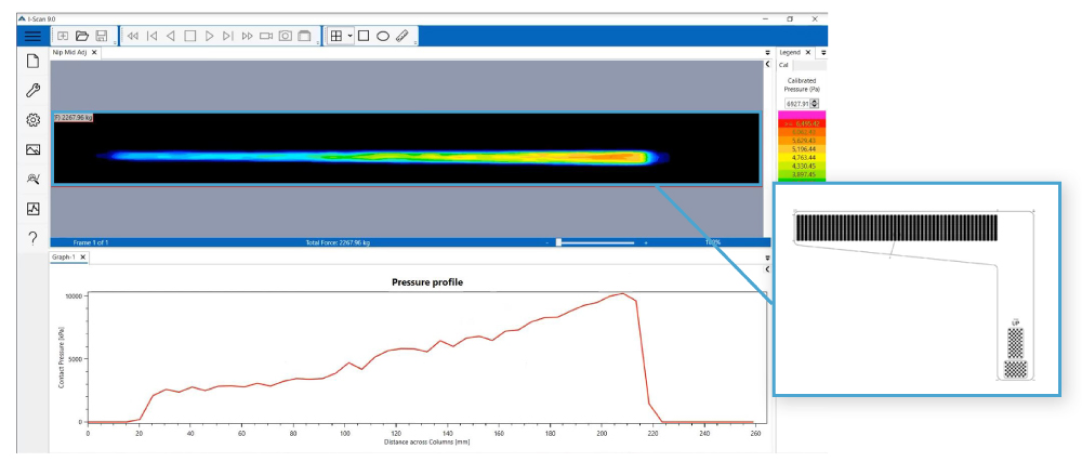
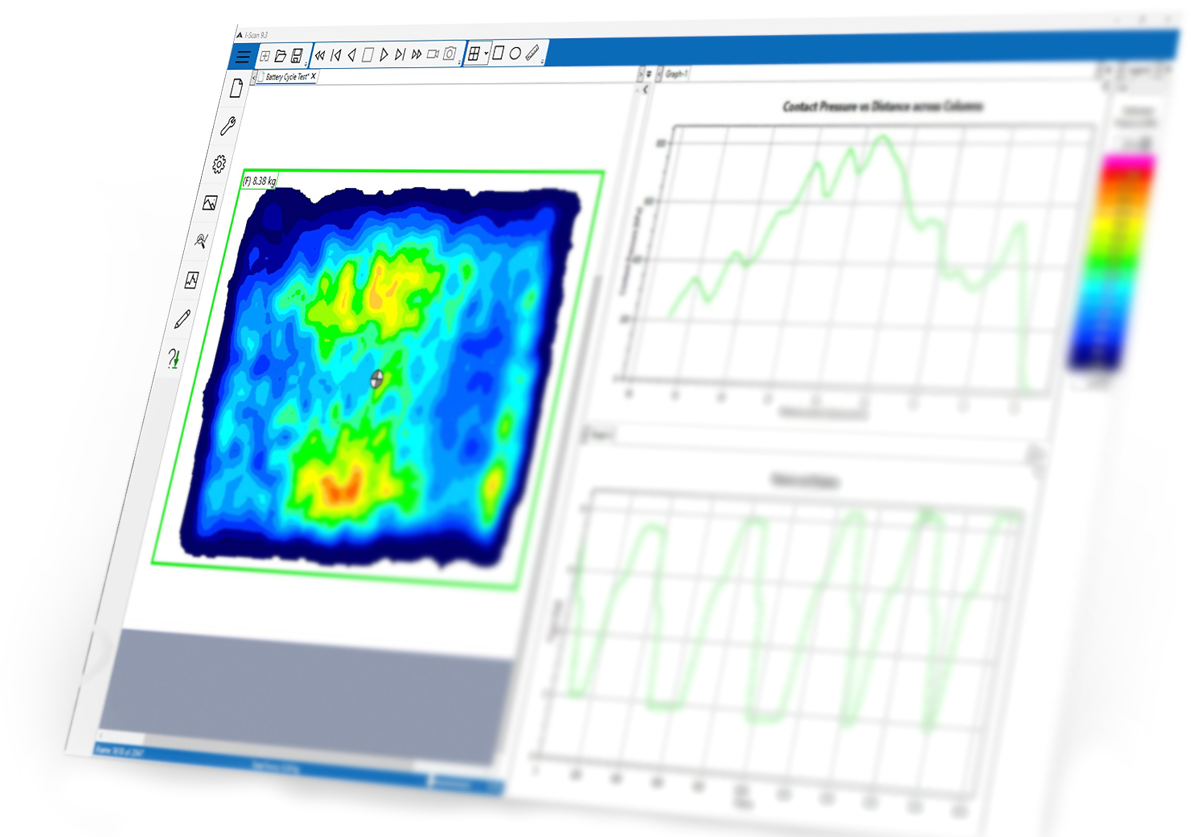
Superior Data Analysis
I-Scan™ provides the tools for more comprehensive and higher quality analysis than ordinary pressure sensing technologies.The software displays the pressure distribution data, in multiple formats, for superior analysis.
Graphic & Data Analysis
Graphic & Data Analysis
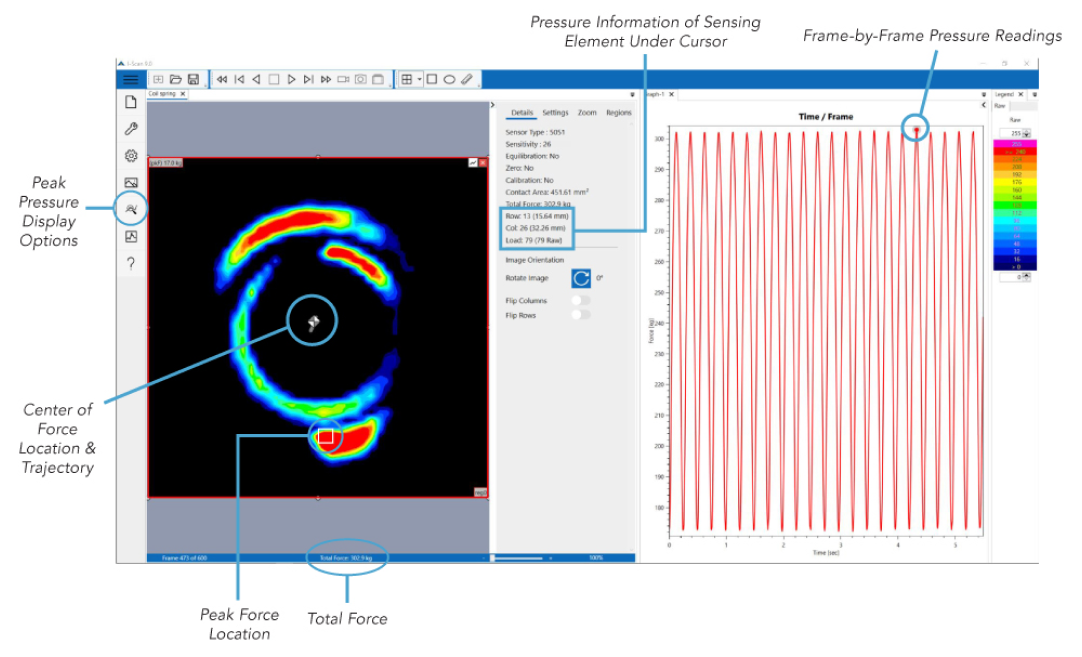
With the ability to capture force over time, users can click at any point of a pressure mapping recording to view the resulting pressure output image.
Data from each frame includes:
- Total force
- Center of force location
- Peak pressure
- Pressure distribution (e.g., force on each sensing element)
Sensor MAPs
Sensor MAPs
Each sensor requires its own unique MAP driver file for the software to function properly. By utilizing sensor MAPs, the software is able to provide an accurate depiction of each unique sensor layout. The sensor MAP controls the shape of the pressure image window in the software, which corresponds to the shape and dimensions of the sensing area on the sensor.
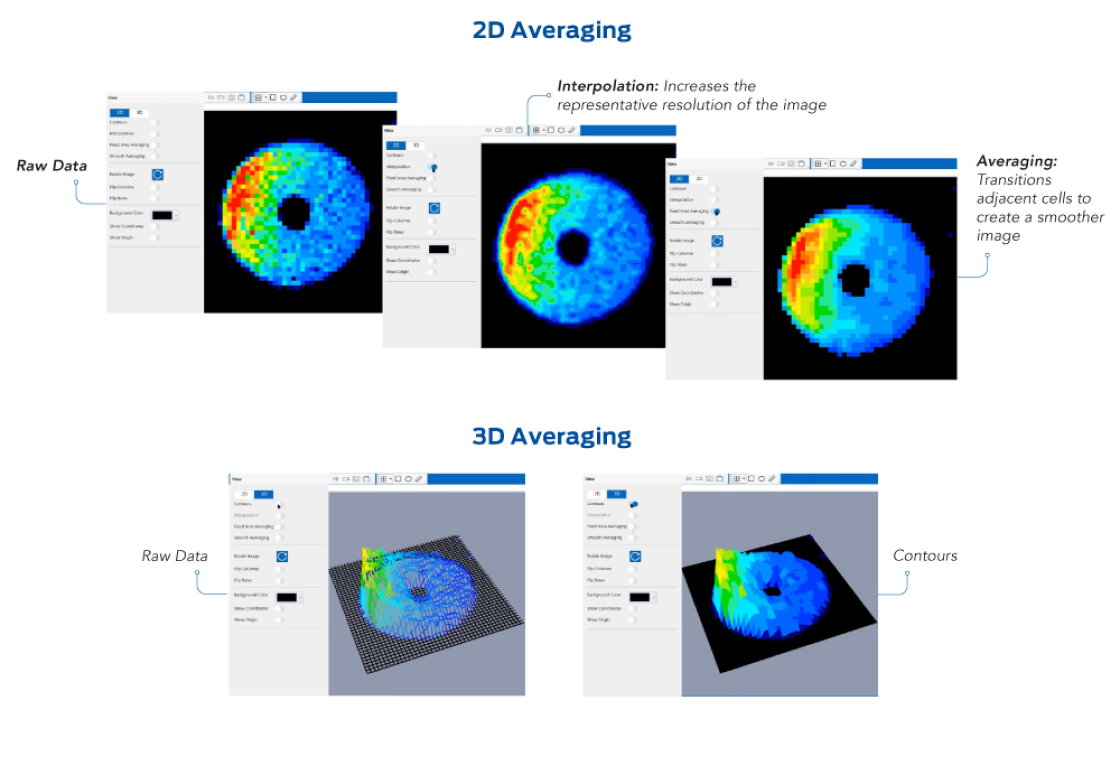
Visualization
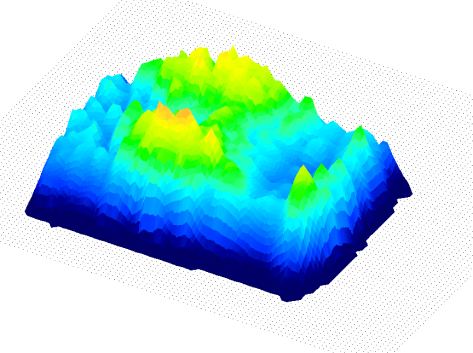
Visualization
I-Scan 9 offers optimized 2D and 3D display algorithms in the software to average sensor data into a smooth pressure map display; giving a more realistic representation of the object being measured. Select among several averaging views, including combination views.
I-Scan Evolution software can run from a Windows computer or tablet.
I-Scan Evolution software can run from a Windows computer or tablet.
Unique Applications for the I-Scan System
Unique Applications for the I-Scan System
What’s New with I-Scan?


Visit Us at the Battery Show Europe
Tekscan with be exhibiting at The Battery Show Europe with our partners, CMV.
Featured Resources


Contact an I-Scan Expert
Are you interested in finding out how I-Scan can provide the impactful insights from surface sensing you need to make more informed decisions? Complete the form to: Ask a quick question Schedule a demonstration Request a quote
Complete the form to:
- Ask a quick question
- Schedule a demonstration
- Request a quote