By Jayne Arlett, BSc Pod Med, FASMF, FAAPSM
Diabetic Foot Ulcer Treated with Proper Footwear and Orthotic Prescription
A diabetic patient with a long term (15 months) non-healing ulcer under the left midfoot (Charcot Joint) was presented to private practice. The F-Scan™ plantar pressure analysis system and the F-Mat™ floor mat were used to assist the podiatrist and the patient to achieve optimal treatment outcomes. The ulcer site healed within one month of orthotic modification with the assistance of the F-Scan. More importantly, the patient was significantly more compliant with recommended treatments once he could visualize the extremely high and abnormal pressures that his ulcer site was generating while walking barefoot on the F-Mat. The F-Scan's ability to demonstrate to the patient the importance of footwear and orthotic therapy in this case perhaps outweighs the assistance that it gave to the podiatrist in maximizing treatment outcomes.
Presented below are F-Mat pressure profiles of barefoot walking showing peak pressure over ulcer site, and F-Scan pressure profiles showing a reduction in pressure with orthotic and footwear.
 Diabetic Ulcer Before Orthotic
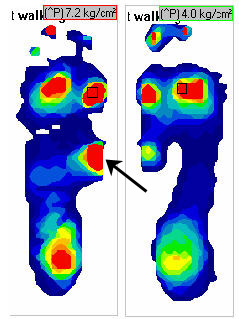
F-Mat™ Screening - Before Orthotic
To the left is a barefoot F-Mat pressure profile showing peak pressures over the ulcer site (arrow) and the 1st MTPJ of the left foot. The peak pressure over the ulcer site is 6.8kg/cm2 (102 psi).
 Pressure Profile Before Orthotic
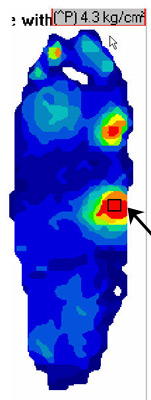
F-Scan™ - Before Orthotic Modifications
To the right is the left pressure profile for in-shoe with orthotic before modifications. The pressure over the ulcer site is reduced compared with barefoot; however, the ulcer is still present. The peak pressure has reduced to 4.2kg/cm2 (60 psi).
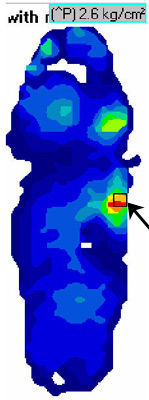 F-Scan - After Orthotic
F-Scan - After Orthotic
To the left is the left pressure profile for in-shoe with modified orthotic. The pressure over the ulcer site is reduced even further to 2.6 kg/cm2 (37 psi) and after 3 weeks of wear, the ulcer has healed completely. The orthotic was modified "on-the-spot" with the assistance of the F-Scan to allow for immediate feedback on the suitability of the modification.
 Peak Pressure Versus Time Curve - After Orthotic
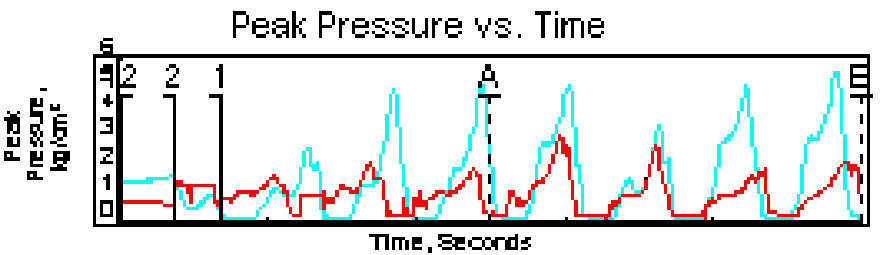
Peak Pressure versus Time Curve After Orthotic
The blue curve shows the peak pressure versus time before the orthotic was modified. The red curve shows peak pressure versus time for in-shoe with modified orthotic. Clearly the magnitude of peak pressure with the new modified orthotic is much lower than before the orthotic was modified. This significant reduction in peak pressure has assisted in the healing of the ulcer.
F-Scan In-Shoe Technology to Assess Pressure Redistribution
See how Tekscan's F-Scan diabetic foot scanner system provides quantitative insights to confirm your orthotic treatments in the video below.
Note: F-Scan software shown in the video above are not representative of the information in the case study above.