FootVIEW
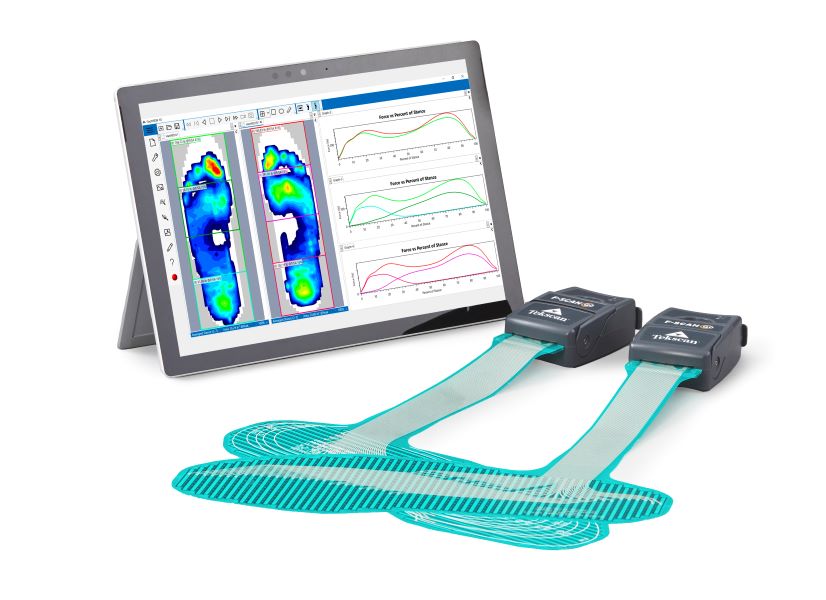
FootVIEW software powers the F-Scan GO In-Shoe Gait Analysis System
F-Scan GO is the next generation of the F-Scan In-Shoe Pressure Measurement system. The F-Scan In-Shoe system provides dynamic pressure, force and timing information for foot function and gait analysis.
The new F-Scan GO system features completely cordless electronics, and is the only In-Shoe Gait Analysis system on the market with the ability to collect data at sampling rates of 500 Hz, which is necessary for impact and sports applications.
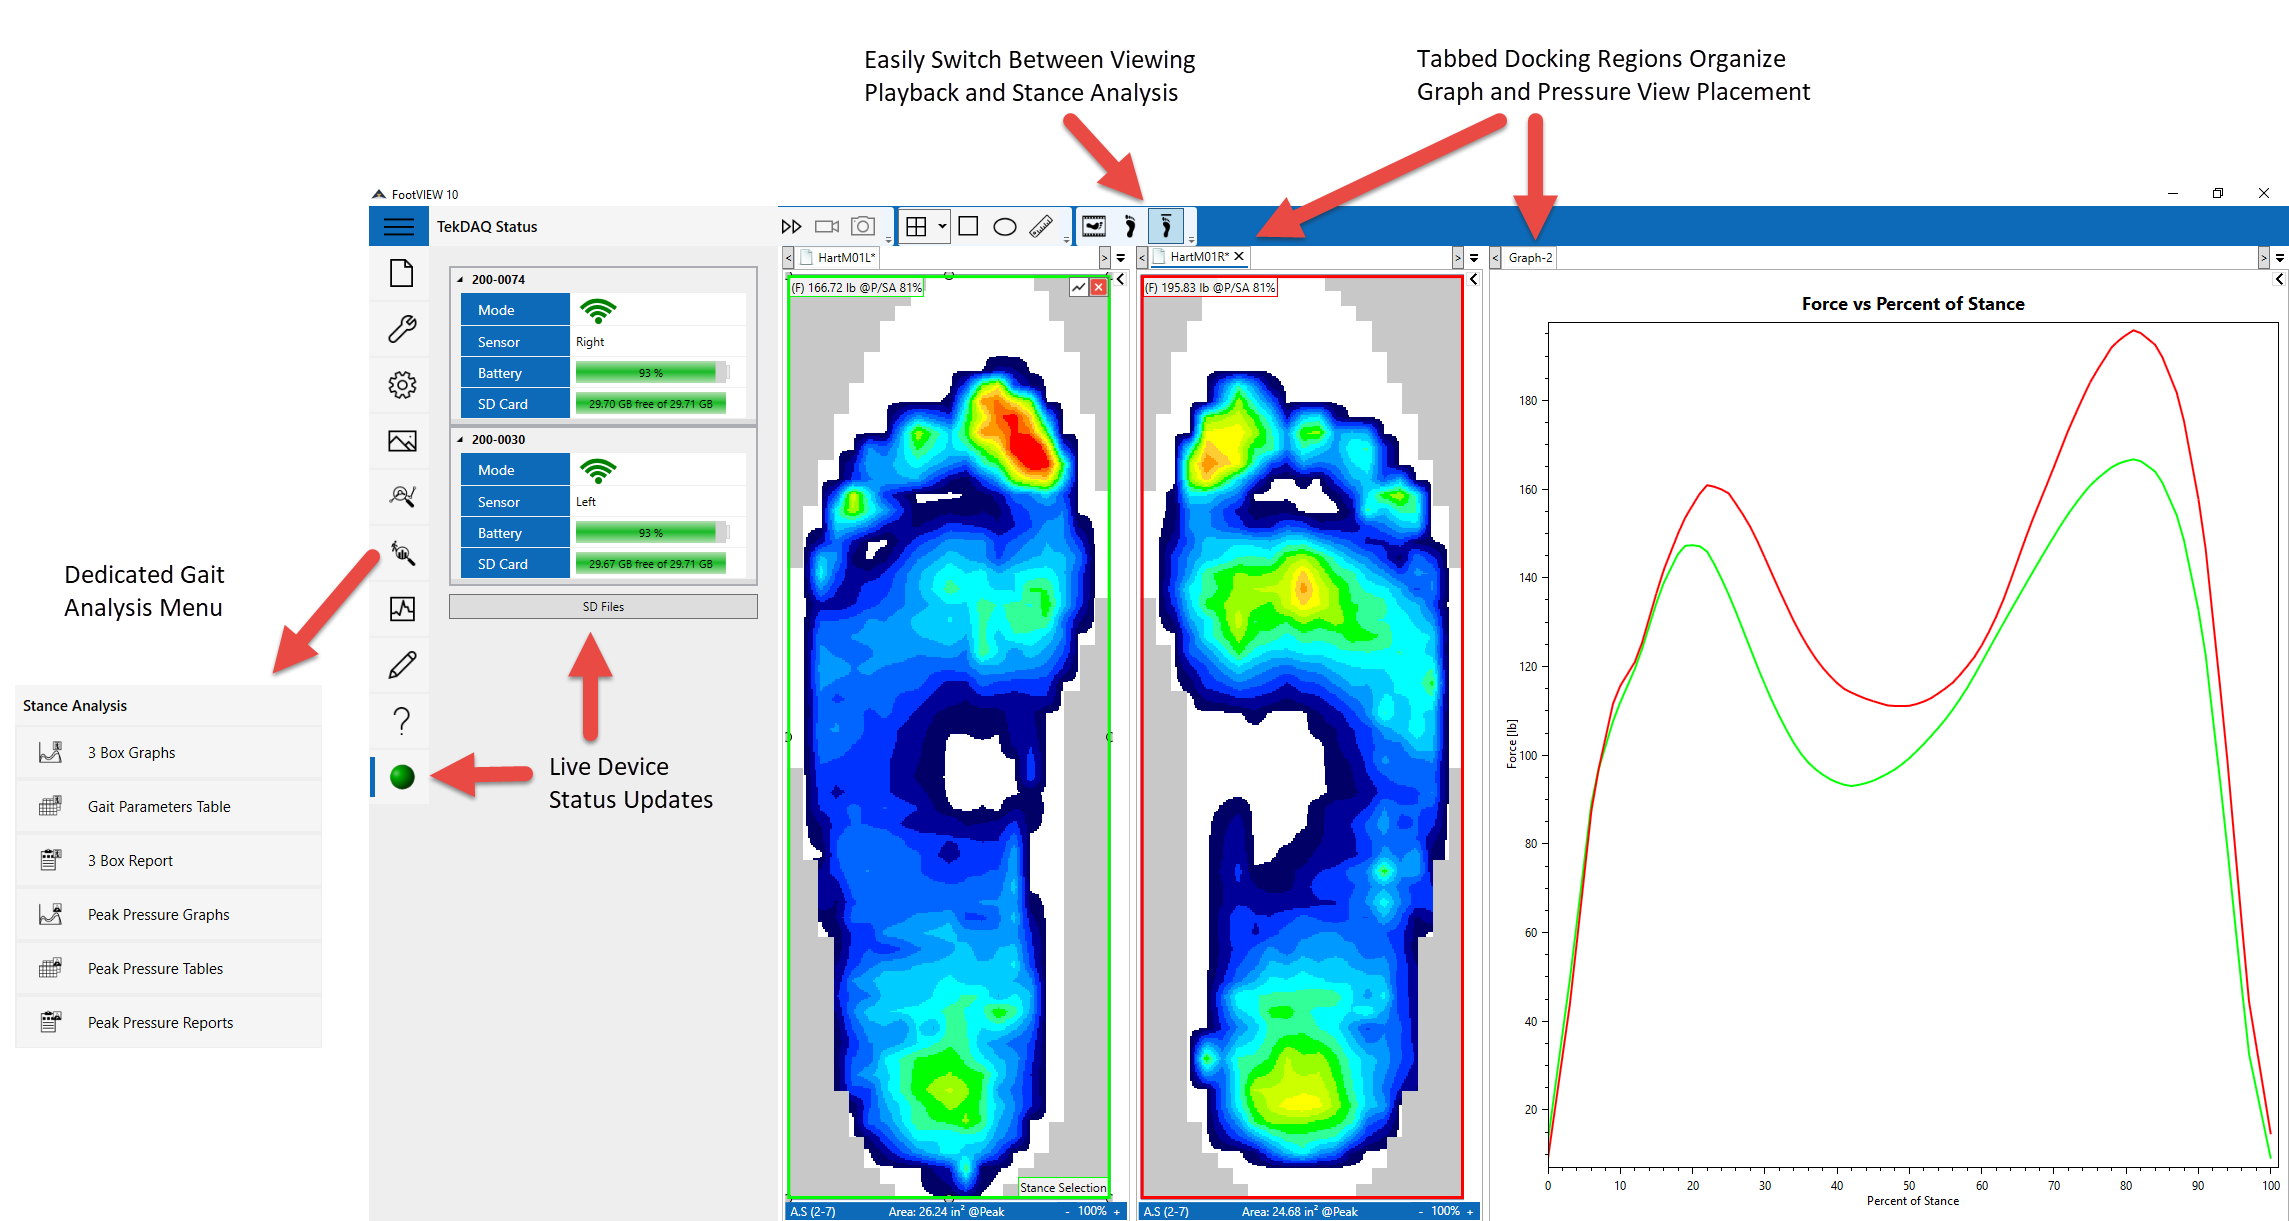
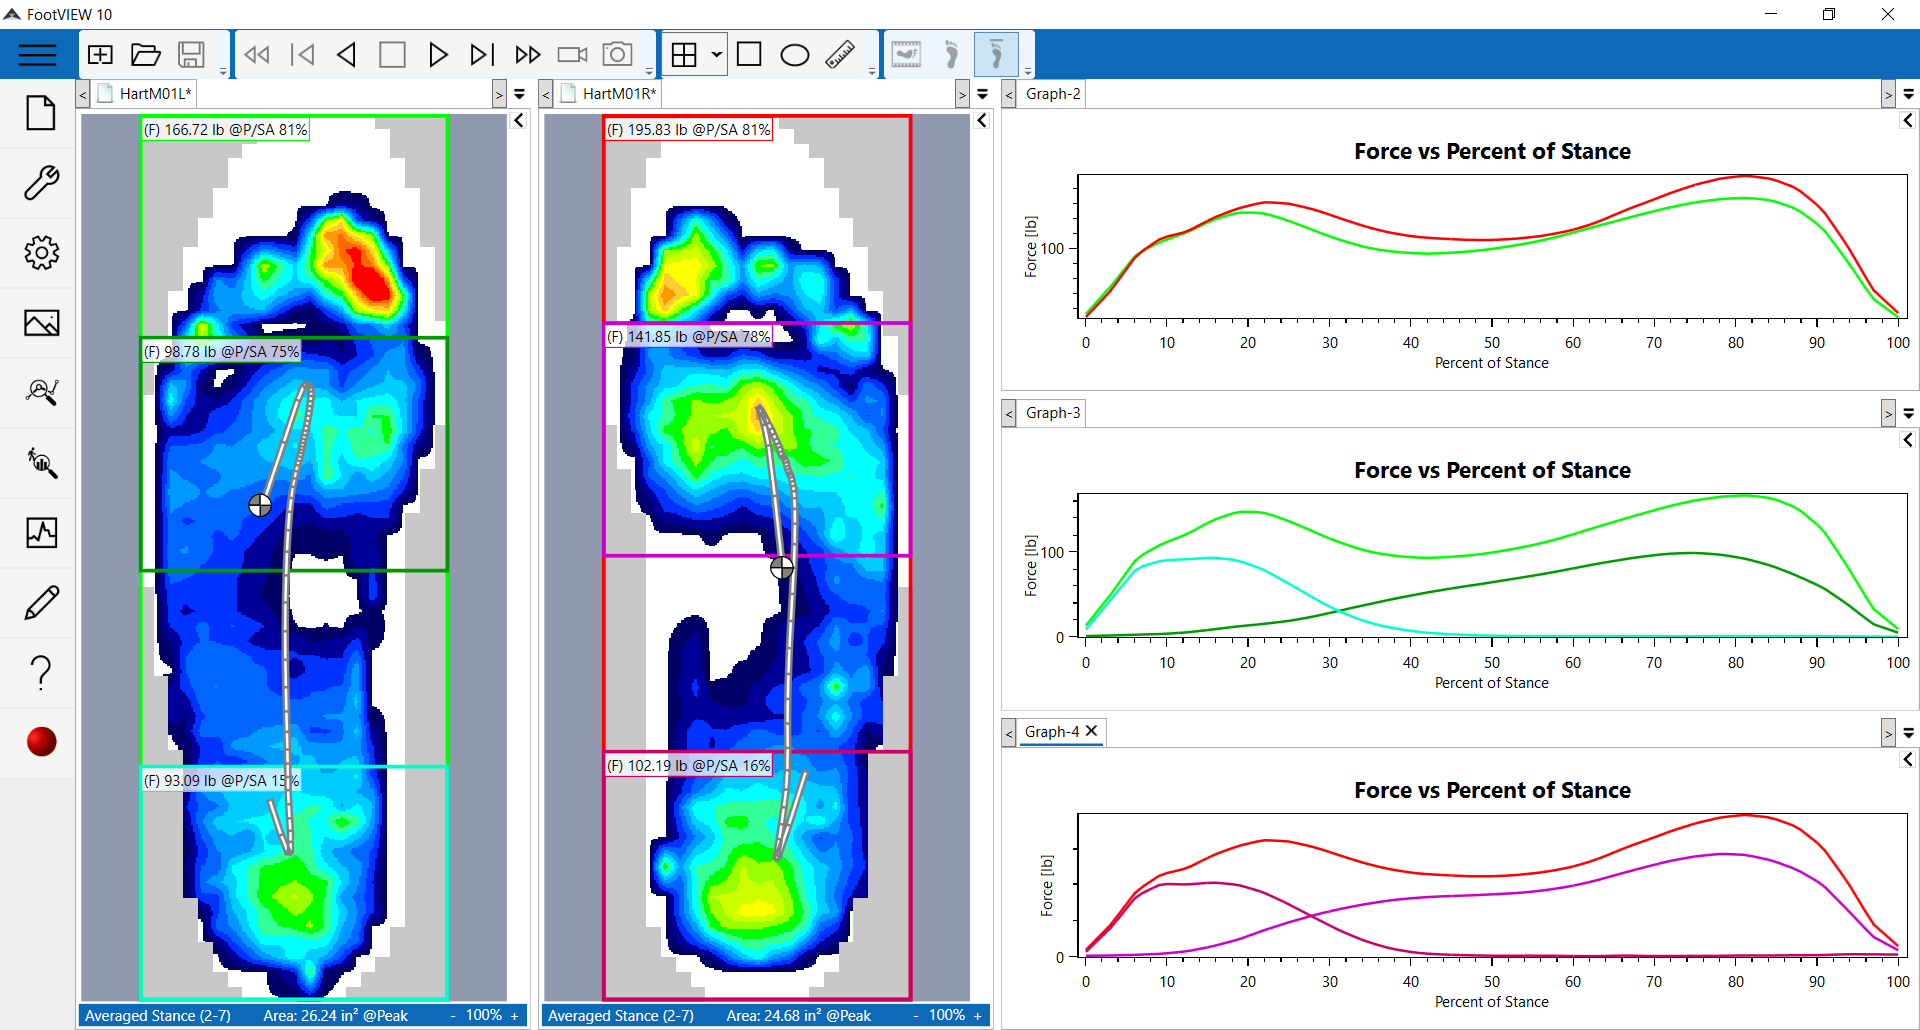
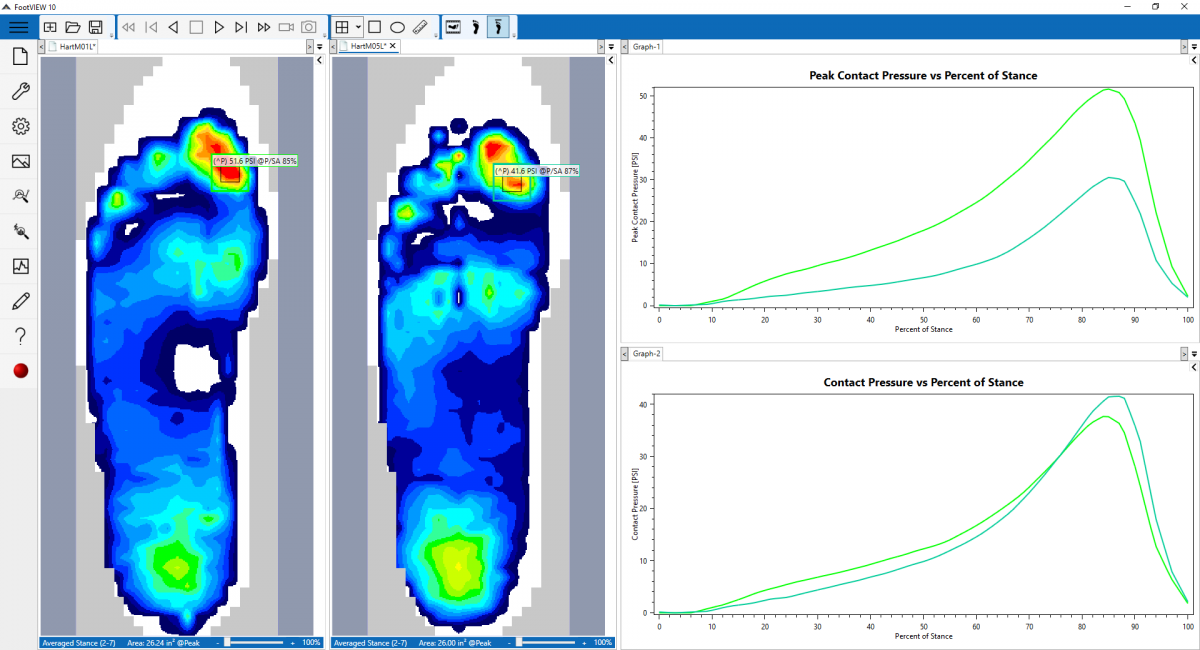
This new software simplifies collection and analysis by focusing on the features most commonly used by researchers and provides a modern interface which can easily organize information. The new docking regions allow you to organize important information such as in-shoe pressure distribution and graphs, peak pressure data, and 3-Box Analysis can be presented in a single dashboard.

FootView for F-Scan GO is available in 2 software configurations.
| FootVIEW empowers clinicians to: | FootVIEW Pro is designed for researchers who need advanced features like: |
|
|
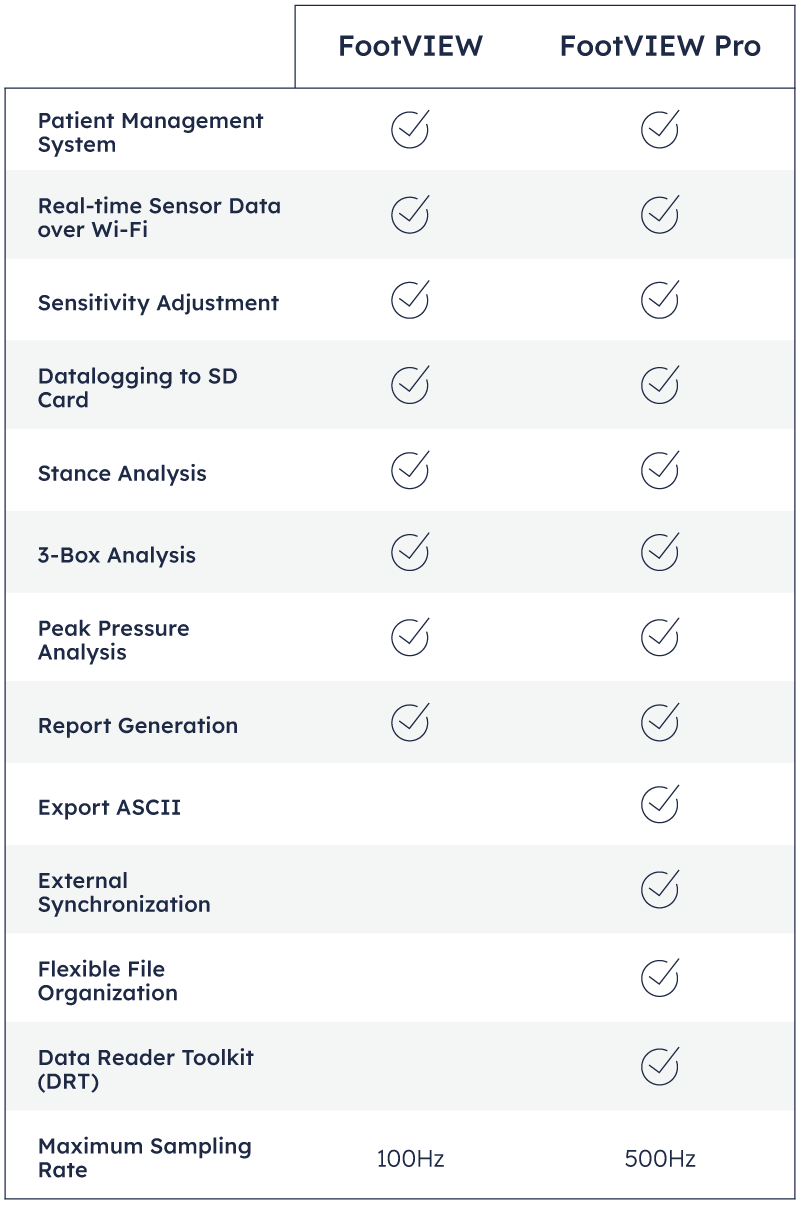
Here is our FootVIEW vs FootVIEW Pro feature comparison chart.
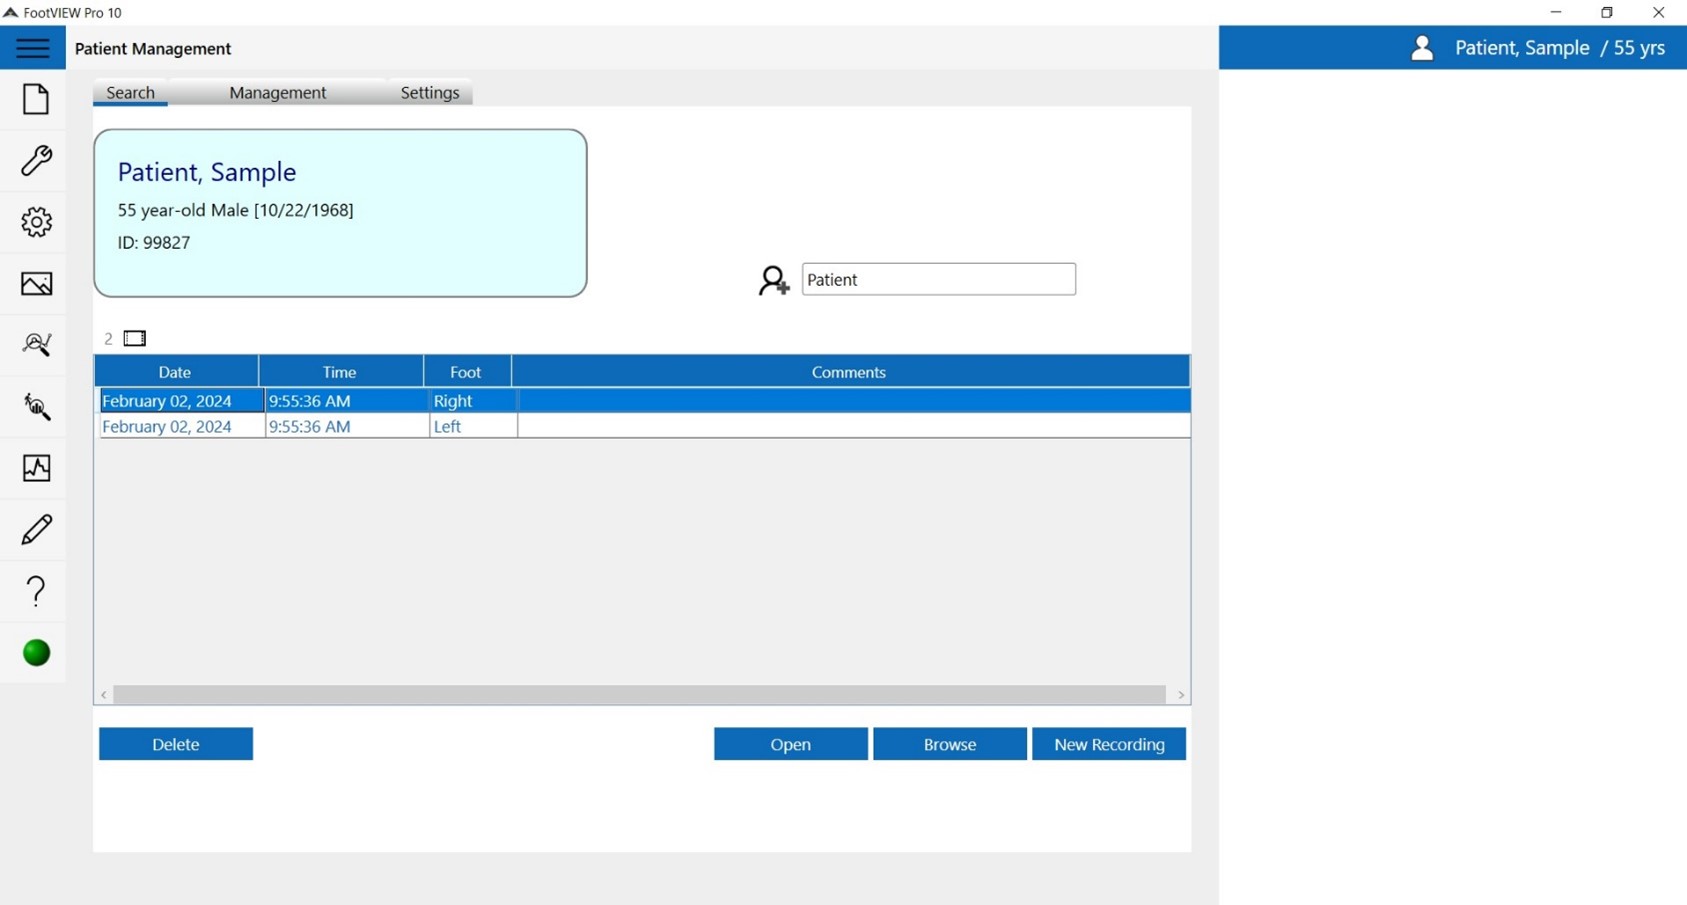
The FootVIEW Patient Management provides an interface for organizing and storing pressure sensor recordings. The system stores a list of patients and automatically stores pressure recordings into folders linked to each patient record. Recordings collected for each patient may be accessed and opened for analysis through the patient’s record.
FootVIEW Pro includes all the functionality of FootVEW with additional features designed for dynamic activities and research in a biomechanics library
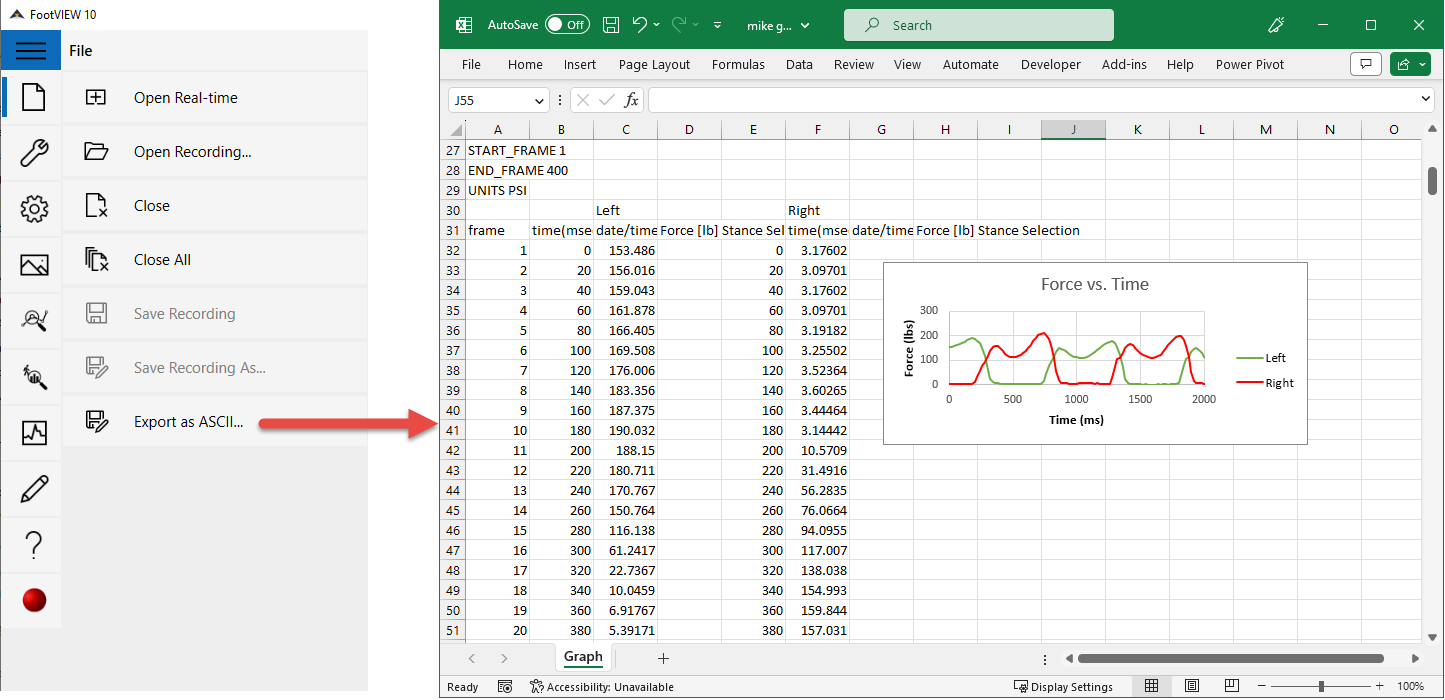
ASCII Export allows sensor data and graphs to be imported and analyzed in external software.
Allows for direct integration with external software for analysis of recorded data.
An optional trigger bundle can be purchased with F-Scan GO with FootVIEW Pro to receive a TTL level signal from an external device to trigger the start of the F-Scan GO recording.
FootVIEW and FootVIEW Pro requires a Windows based computer, laptop, or tablet. It will work on any 64bit Windows system, which includes all Microsoft Windows 11 systems, and many Windows 10. See our FAQ for details.