
How Does Footwear Material Affect Human Gait?
 Marshall Kendall, PhD.When selecting corrective footwear or orthotics for your patients, understanding how your decisions may affect human gait becomes a lot more complicated than what meets the eye. Some individuals may have gait asymmetries without any clear visual signs, or any presence of pain. In fact, it’s probably unrealistic to assume that most healthy individuals without any diagnosed pathologies will fall into a normal style of gait. This is because the human body may mask these pathologies through compensations, which can prompt even more issues further up the kinetic chain (ankles, knees, hips, and back).
Foot specialists, among other treatments, apply corrective measures, including specialized footwear, orthotics, and braces, to address these pathologies. However, this often based on the physical assessment and visual observations of a patients gait. Many clinicians rely on patient feedback to determine success or failure of their treatment with little quantifiable proof on whether their decisions are positively influencing the gait patterns of their patients.
In-shoe pressure measurement technology becomes a useful tool for analyzing how footwear materials influence a patient’s gait pattern. Having the ability to position pressure sensors within the subject or patient’s shoe helps tell the complete story as to whether the intervention is correcting a problem, or causing more challenges.
Example of a Footwear Material Comparison Using an F-Scan™ System
Subject Information:
- Subject has been diagnosed by a Podiatrist with Equinus, Limb length discrepancy and Functional Hallux
- No pain complaints, and no current orthotics
Data Collection:
- The test completed in standard running shoes
- 30 seconds of continuous foot-step on a treadmill
- Walking speed was 3.0 mph
-
Analyzed in 3 conditions:
- No intervention
- Hard heel lift (dense cardboard)
- Soft heel lift (standard pharmacy soft heel lift)*
Results
Intervention on Left Foot
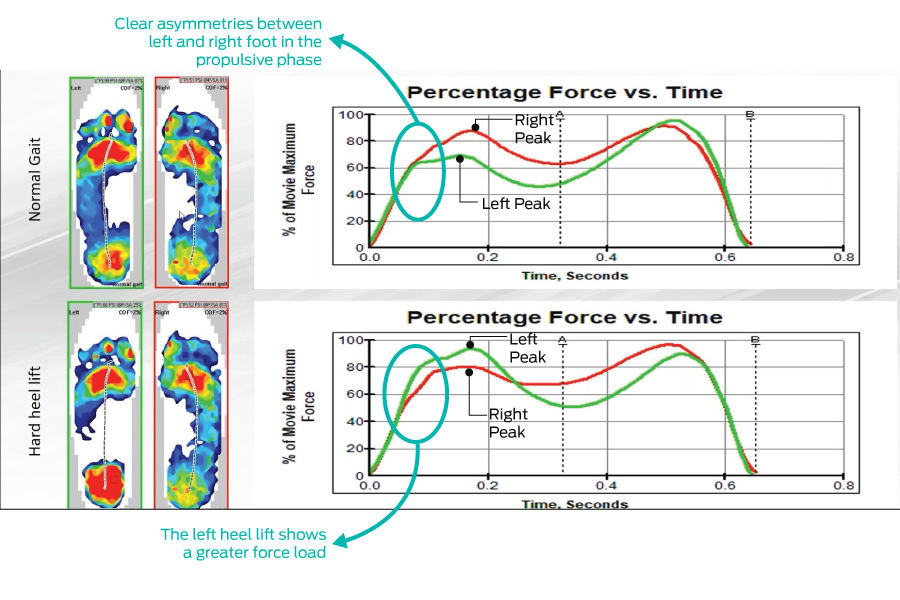
The F-Scan data above represents an average of 26 footstrikes with the subject walking in both without an intervention, and with a hard heel inserted into their left shoe only. The red lines depict the right foot, while the green line depicts the left foot.
- The normal gait curve demonstrates asymmetries, with the right foot exhibiting higher heel load than the left, then come together at the propulsive phase towards the end of the step
- The hard heel curve exhibits a change in the left foot, where the left heel portion is now higher than the right
- The loading on the left hard heel lift also continues to exhibit more force earlier in the step than in the normal condition
- The normal curve also displays an asymmetry in peak force between the left and right foot, whereas, the high heel curve shows a similar positions of peak force
*To view the soft heel lift results, along with additional context and findings from this study, download our on-demand webinar “Measuring Changes in In-Shoe Intervention.”
Post Categories: