
Foot Orthotics Provide Measurable Relief from Chronic Back Pain
By Bruce E. Williams, DPM
Merrillville, IN
www.breakthroughpodiatry.com
According to Dr. Howard Dananberg1, there is a functional relationship between poor foot function and chronic low back pain. Dr. Dananberg has performed two studies comparing the improvement in outcomes of patients with chronic low back pain, who were treated only pending assessment using F-Scan™ System for plantar pressure analysis. These patients had their custom foot orthotics modified according to certain objective parameters quantified by the F-Scan. At least 80% of these patients experienced significant improvements of their back pain.
The following represents a patient with chronic low back pain and no foot pain symptoms.
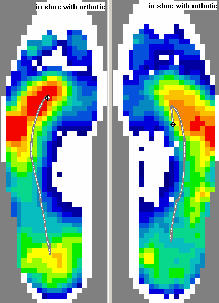
Pressure Profiles - Before Orthotics
Displayed left is a patient with asymmetry of function in his feet. Notice the low pressures under the 1st metatarsalphalangeal joint (mpj) bilateral, and also the lateral deviation of his Center of Force (CoF) trajectory (gray line). A functional hallux limitus is contributing to his chronic back pain.
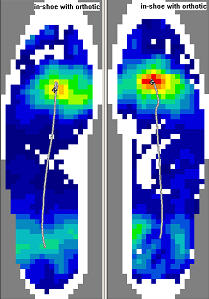
Pressure Profiles - After Orthotics
Displayed to the left is the same patient after treatment. Notice the increase in sub 1st mpj pressures and the medial displacement in the trajectory for the CoF (gray line). The patient's gait became much more symmetrical after treatment with custom foot orthotics.
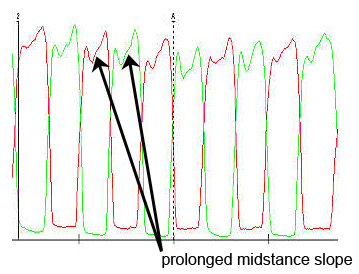
Force versus Time Curve - Before Orthotics
In the graph above, notice the asymmetry in the Force vs. Time curves. Also note the prolonged midstance slope on both curves. This represents poor foot function, and is corroborated in the static F-Scan left and right foot pressure profiles displayed above.
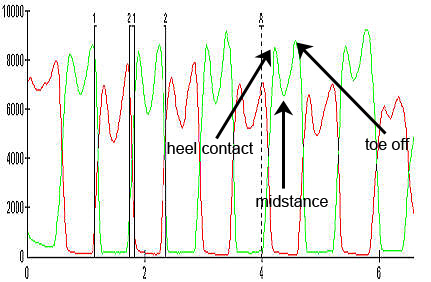
Force versus Time Curve - After Orthotics
In the graph to the right notice now after treatment the increased symmetry in the Force vs. Time curves relative to the graph on the left. This represents final exam of the patient's foot pressure profiles above. "See" how there is a much smoother transition from heel contact to midstance to toe off. The midstance period is not flattened nor delayed at any portion. This translates to improved outcome in patient back pain.
1Dananberg, H. J. and M. Guiliano (1999). Chronic Low-Back Pain and Its Response to Custom-Made Foot Orthoses. Journal of American Podiatric Medical Association. 89: pp109-117.