Skip to main content

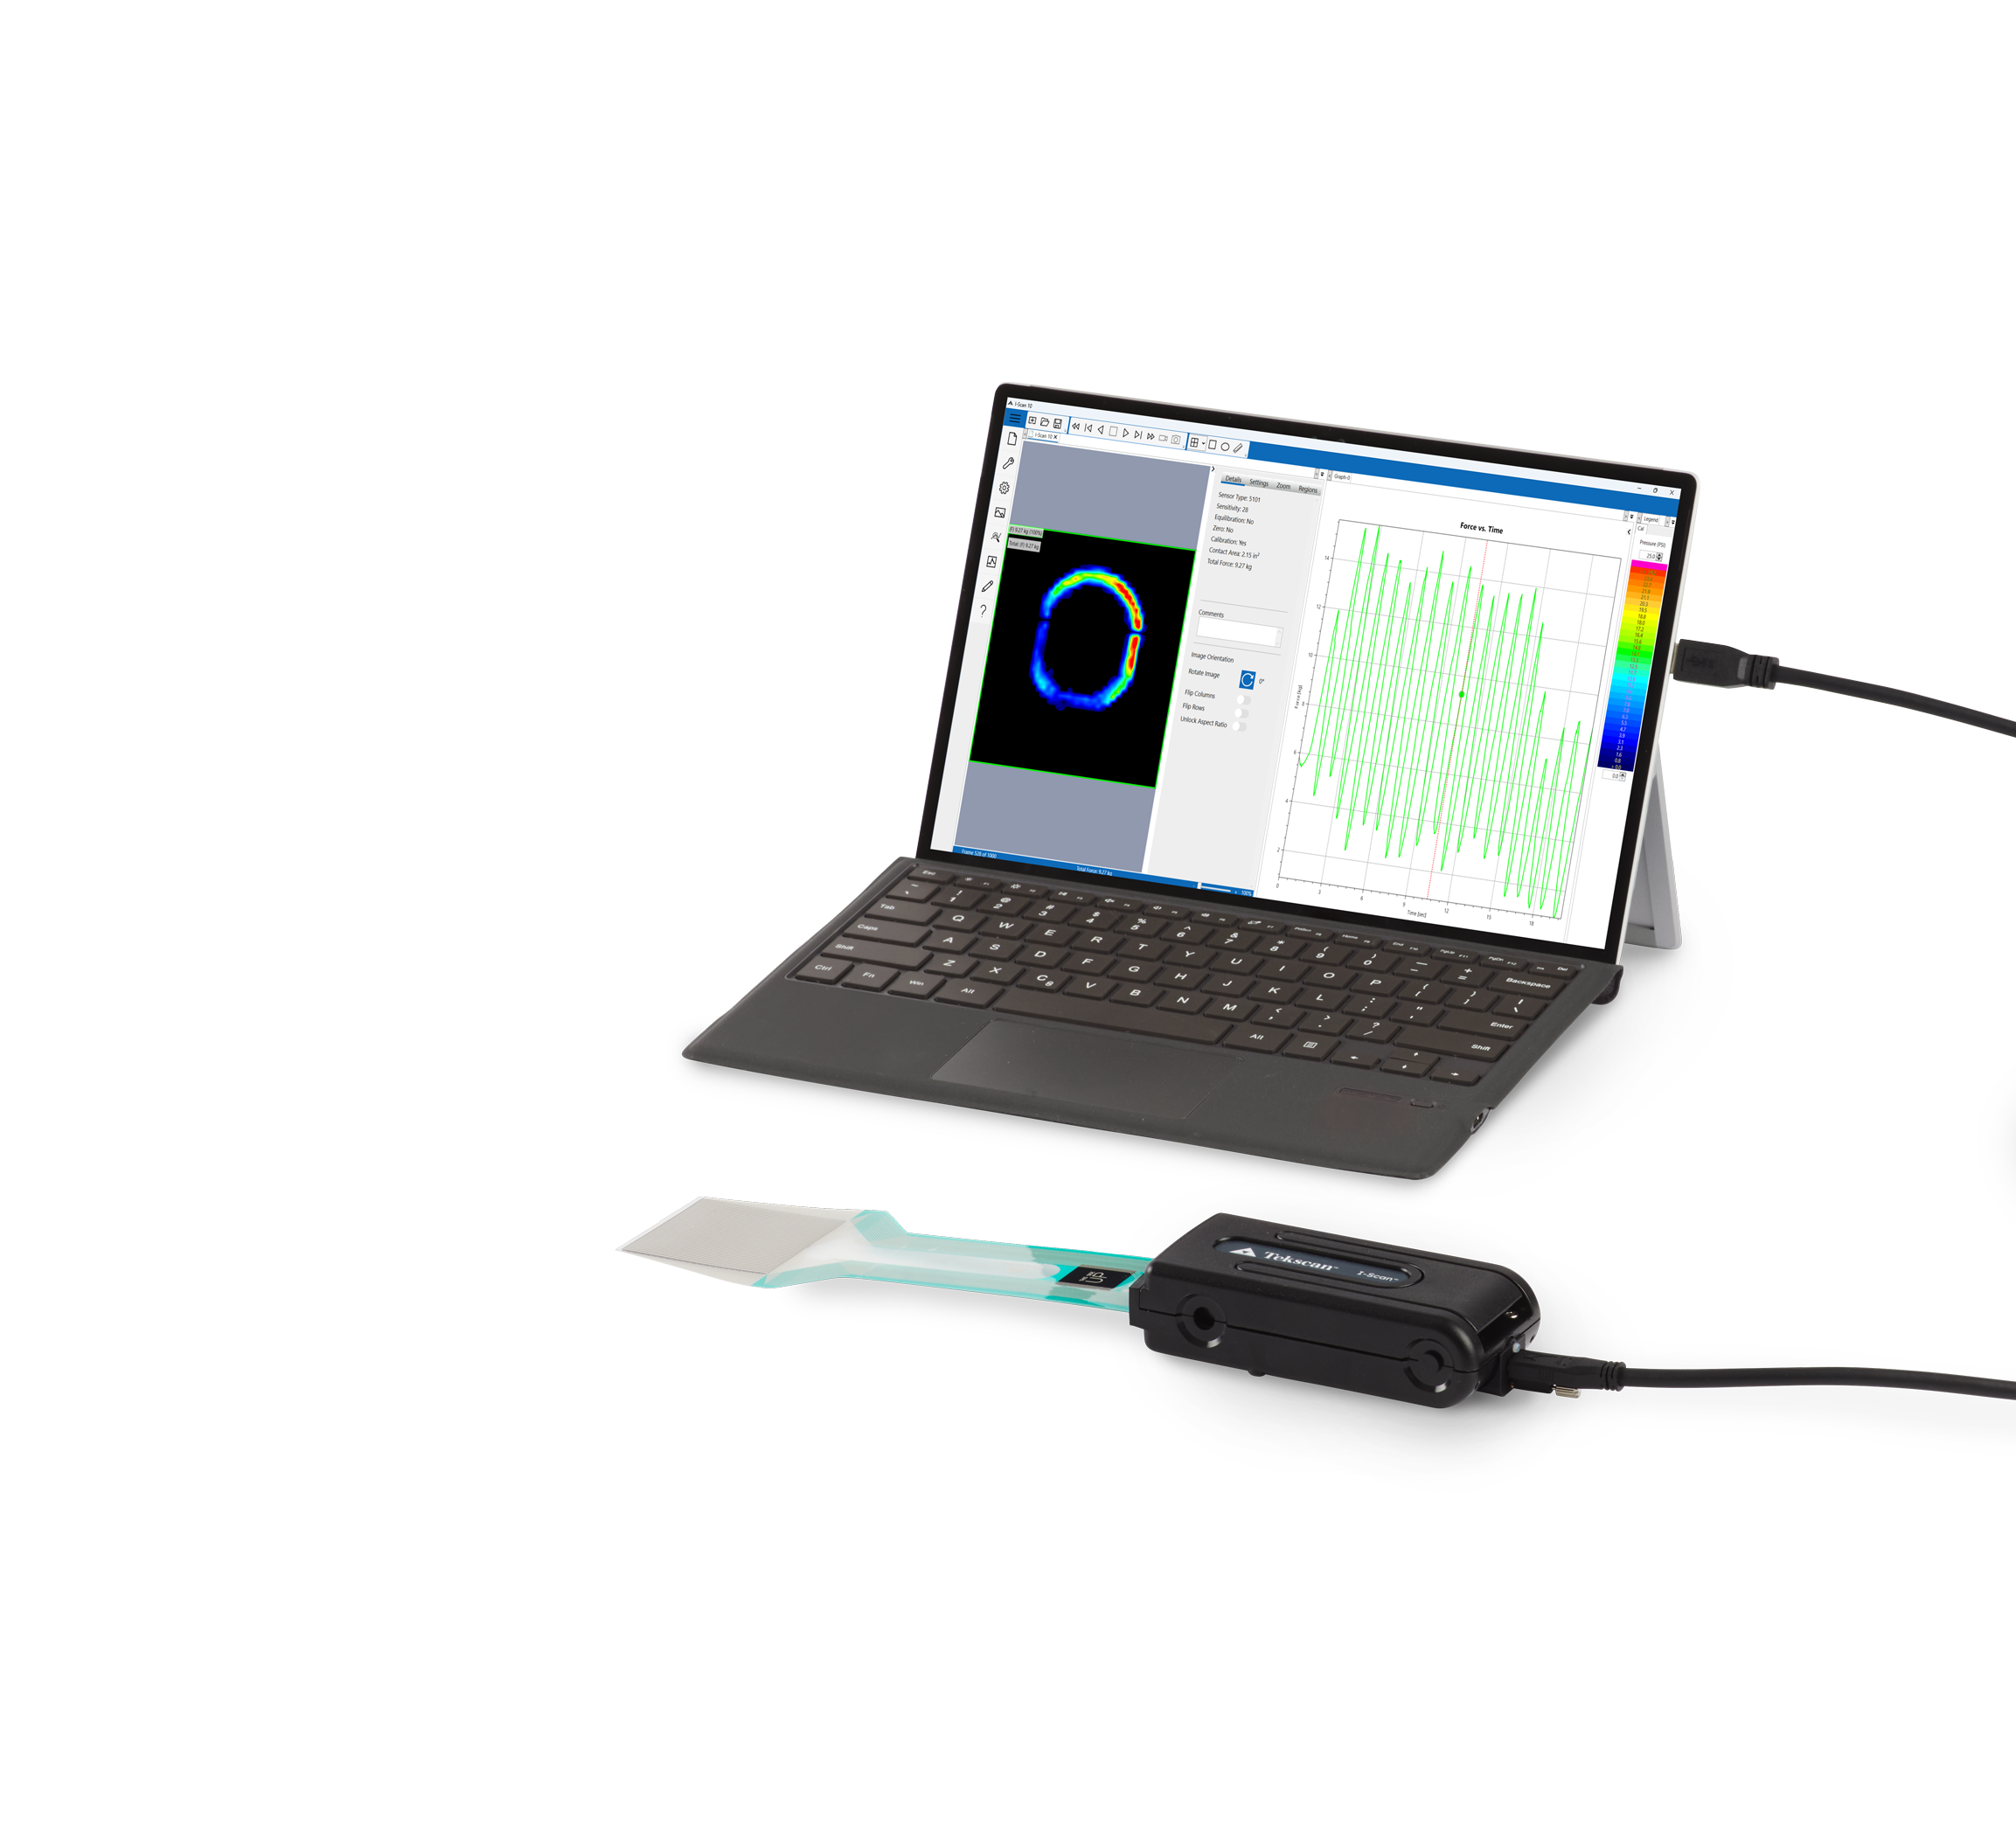
I-Scan™ 10 System Featuring TekDAQ 220 Electronics
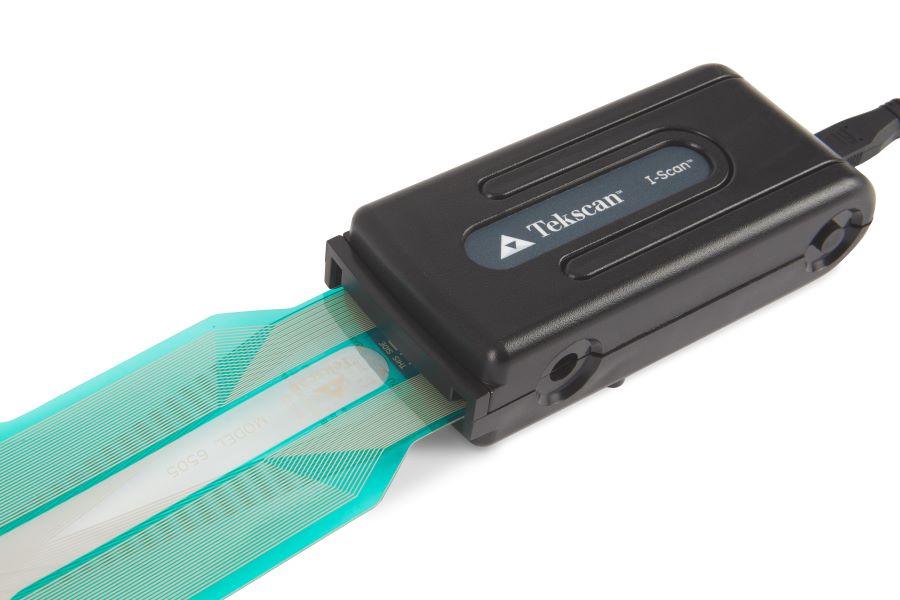
I-Scan™ measures and analyzes interface pressure between two surfaces, utilizing a thin and flexible sensor. Measuring force, pressure, and temperature, this exceptionally thin tactile sensor produces minimal interference between the objects being measured, allowing the system to capture and display the true interface pressure data. Users gain vital insights otherwise unseen surface measurement details. These insights help enhance product design, manufacturing, quality, and research.
Industrial-Grade Data Acquisition Electronics
TekDAQ 220 rapidly scans sensor data and relays it to the I-Scan software for real-time visualization and analysis. Designed for demanding test environments, its industrial-grade electronics provide enhanced ESD protection and improved resistance to electrical noise.
See What Happens Between Surfaces
Capture and analyze dynamic pressure distribution and force to understand interactions that are otherwise difficult to measure.
Powerful Pressure Mapping Analysis Software
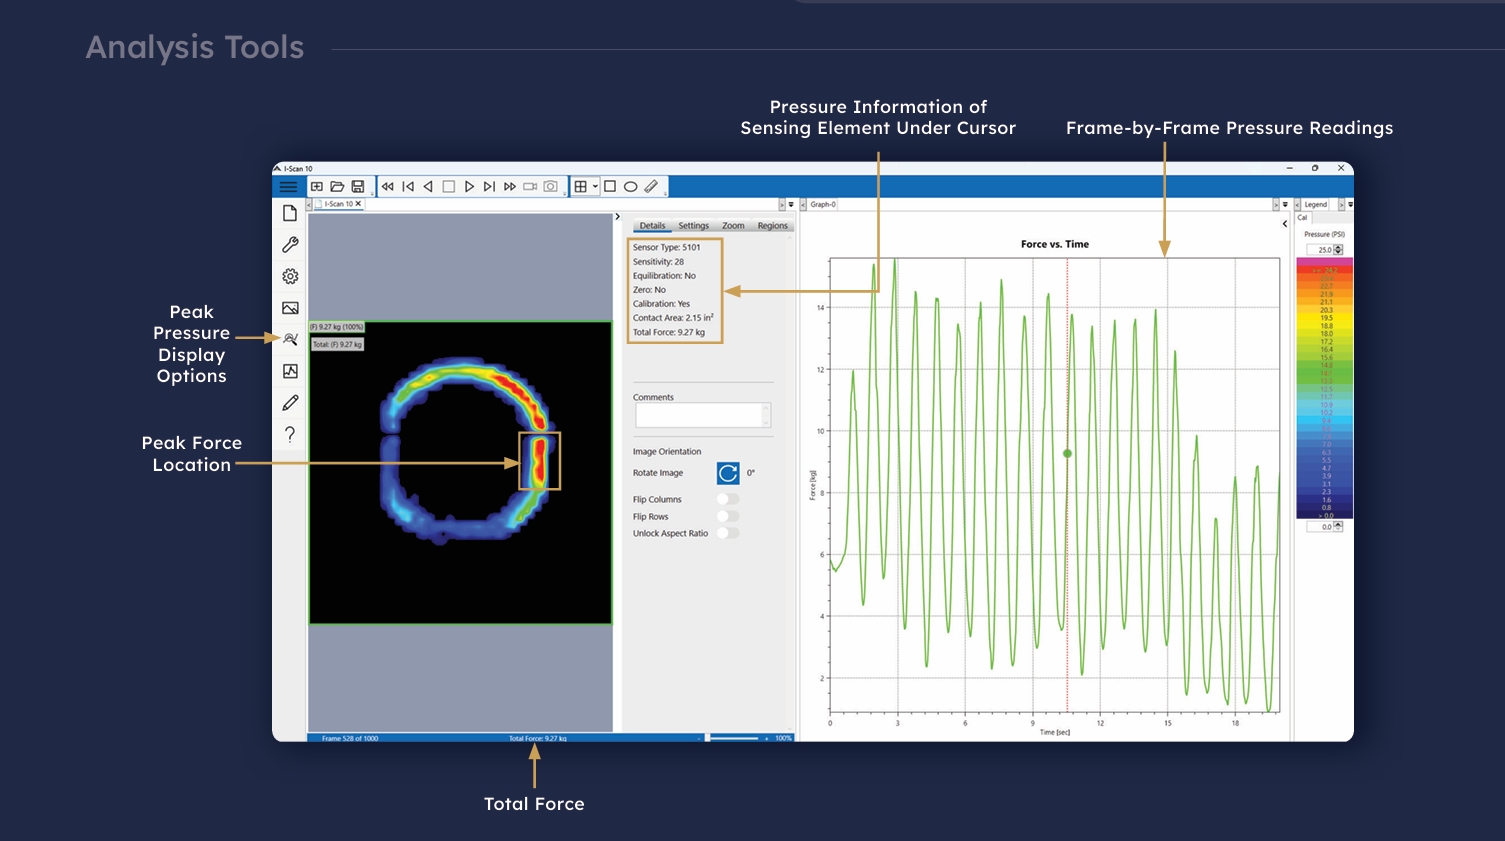
I-Scan Version 10 software transforms sensor data into intuitive, real-time pressure maps and analysis tools, helping users visualize surface interactions, quantify performance, compare results, and identify changes that may otherwise go undetected.
- Real-time display of pressure sensor data in 2D & 3D
- Graphing & data analysis (pressure, force, & area)
- View data as an integrated Microsoft Excel table
- View and compare multiple test results simultaneously
- Display peak pressures & center of force
- Export data and graphs to ASCII
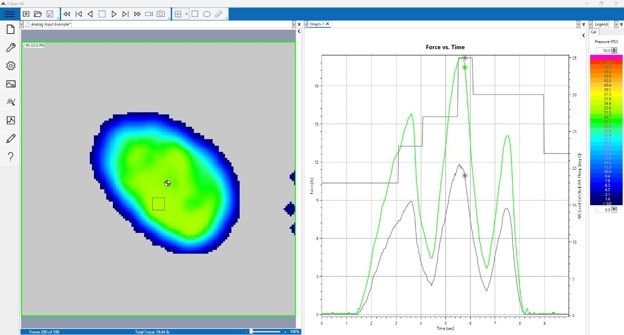
Multi-Axis Graphing
Pressure and analog data, or pressure and temperature data can be graphed on multiple y-axes allowing for improved data visualization.
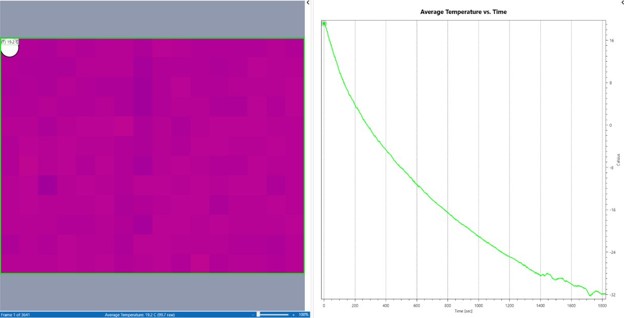
Temperature Mapping Software
Temperature mapping calibration files can be “tared” to quickly reset a T800 temperature sensor to a known, nominal temperature. Temperature mapping data can now be collected at sub-zero temperatures (-50°C – 0°C).
Usability Enhancements
New I-Scan 10 Software Features Include:
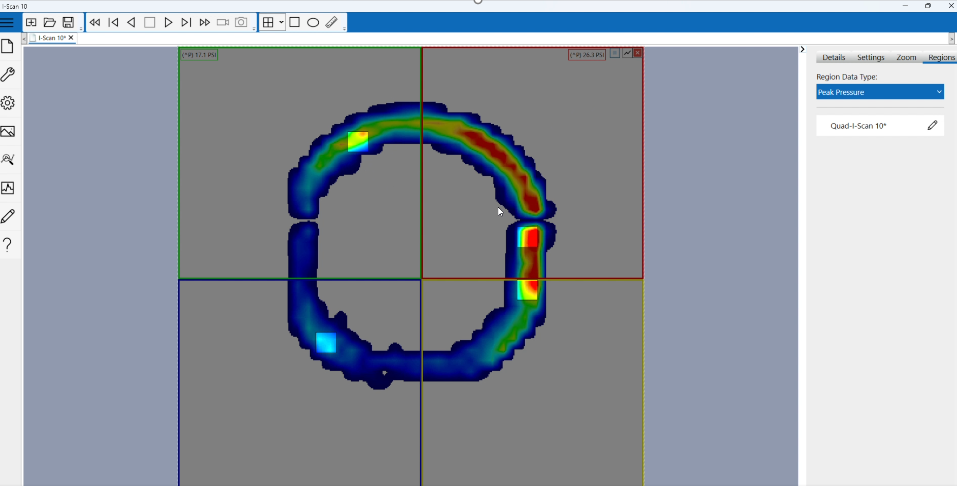
- Multi-Tile Calibration
- Analysis Display Improvements - Panes within the UI can show analysis features including peak force (quantitative value and location) a real-time or recorded window.