F-Scan GO System
Ultra-thin, in-shoe sensors capture timing & pressure information for foot function & gait analysis.
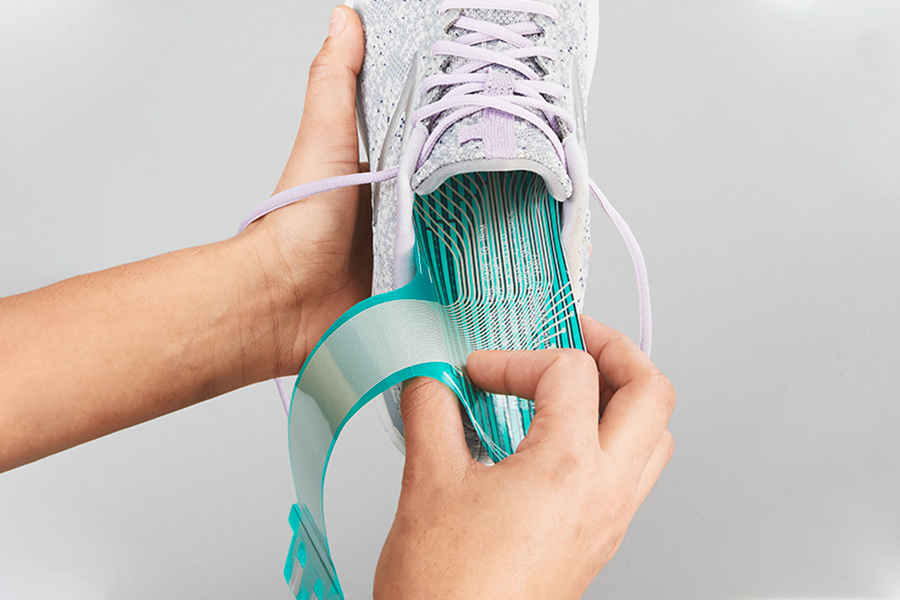
Ultra-thin, in-shoe sensors capture timing & pressure information for foot function & gait analysis.
F-Scan GO is the next generation of the award winning F-Scan in-shoe gait analysis system.
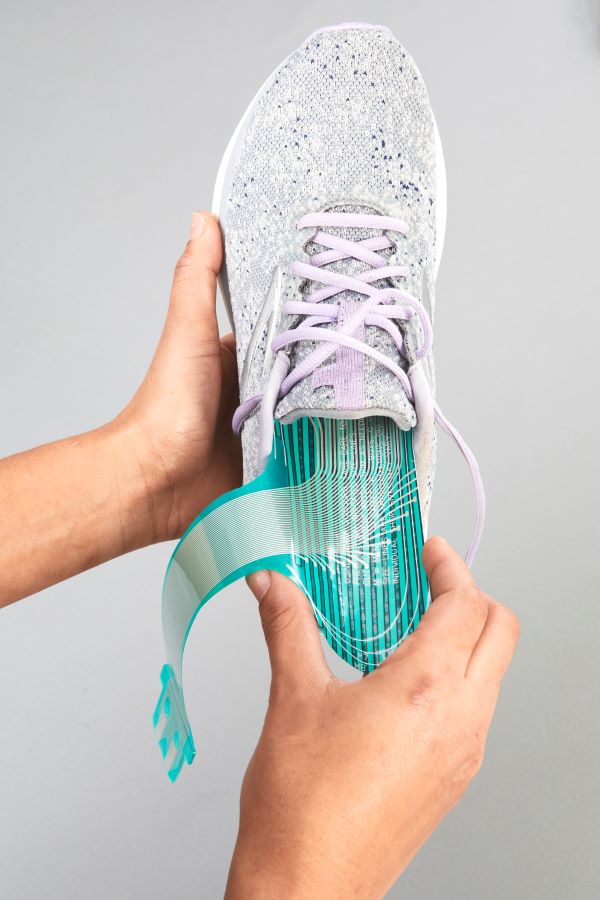
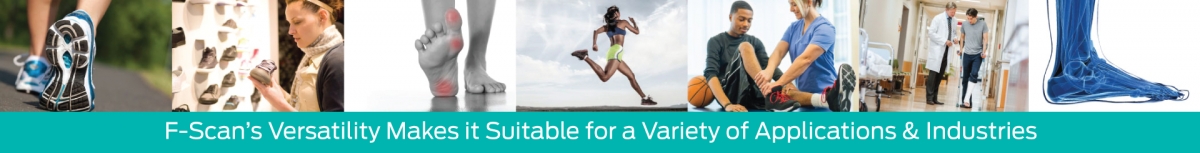
The F-Scan GO In-Shoe system is a compact, new generation technology for clinicians and researchers that provides dynamic pressure, force and timing information for foot function and gait analysis. Information obtained from the F-Scan GO is used in real-world applications, like designing and testing orthotics, offloading diabetic feet and evaluating footwear and techniques in elite athletes.
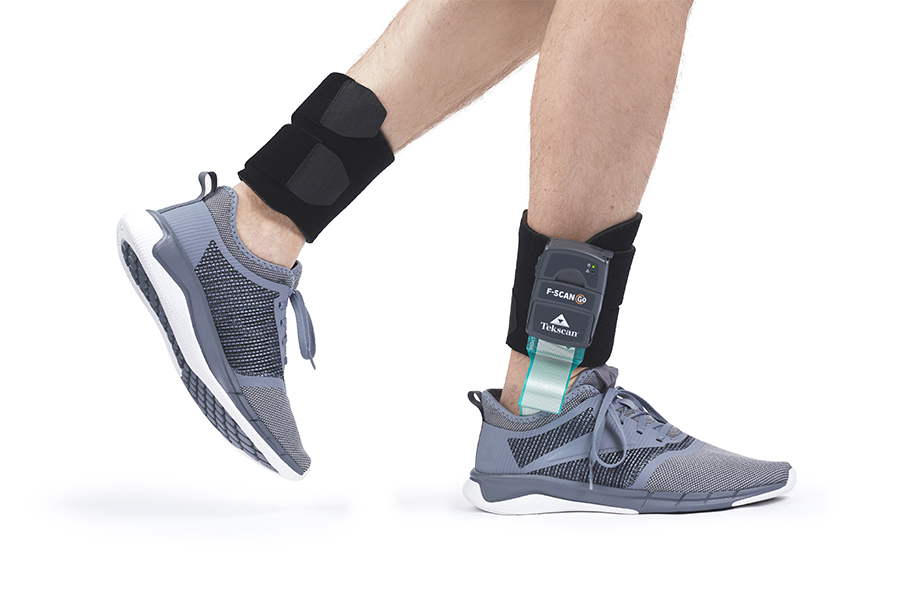
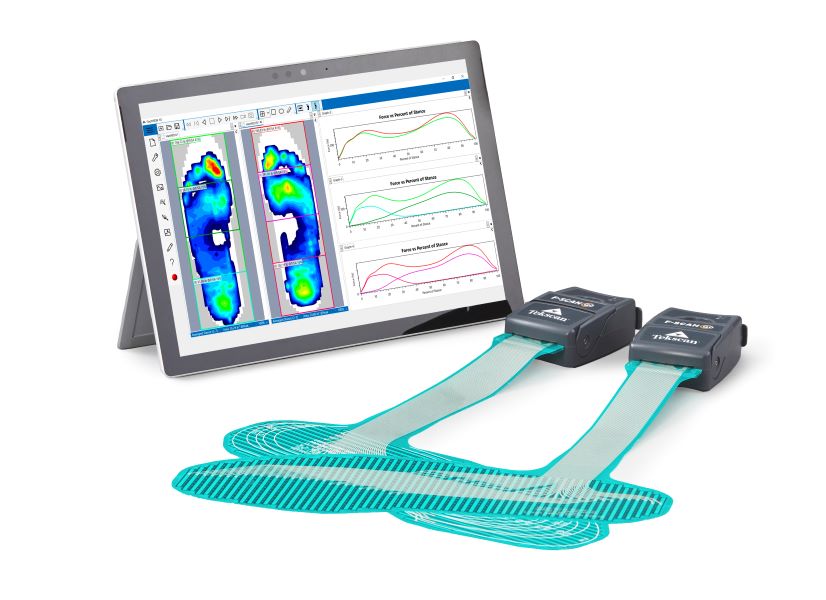
The lightweight, cord-free, wearable electronics with onboard storage lets your subject enjoy full freedom of movement while you capture their natural in-shoe gait with the highest resolution data in the market.

|
Footwear Design Insole Research and Development
|
Plantar Pressure Distribution Analysis for Orthotic Intervention Orthotic Design for Back Pain, Limb Length Discrepancy, and Toe Joint Issues
|
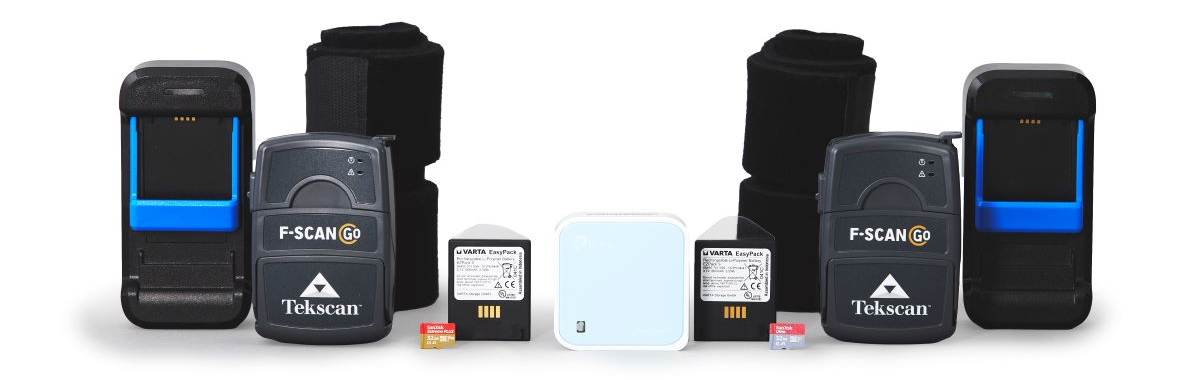
The F-Scan GO system includes:
|
 |

|
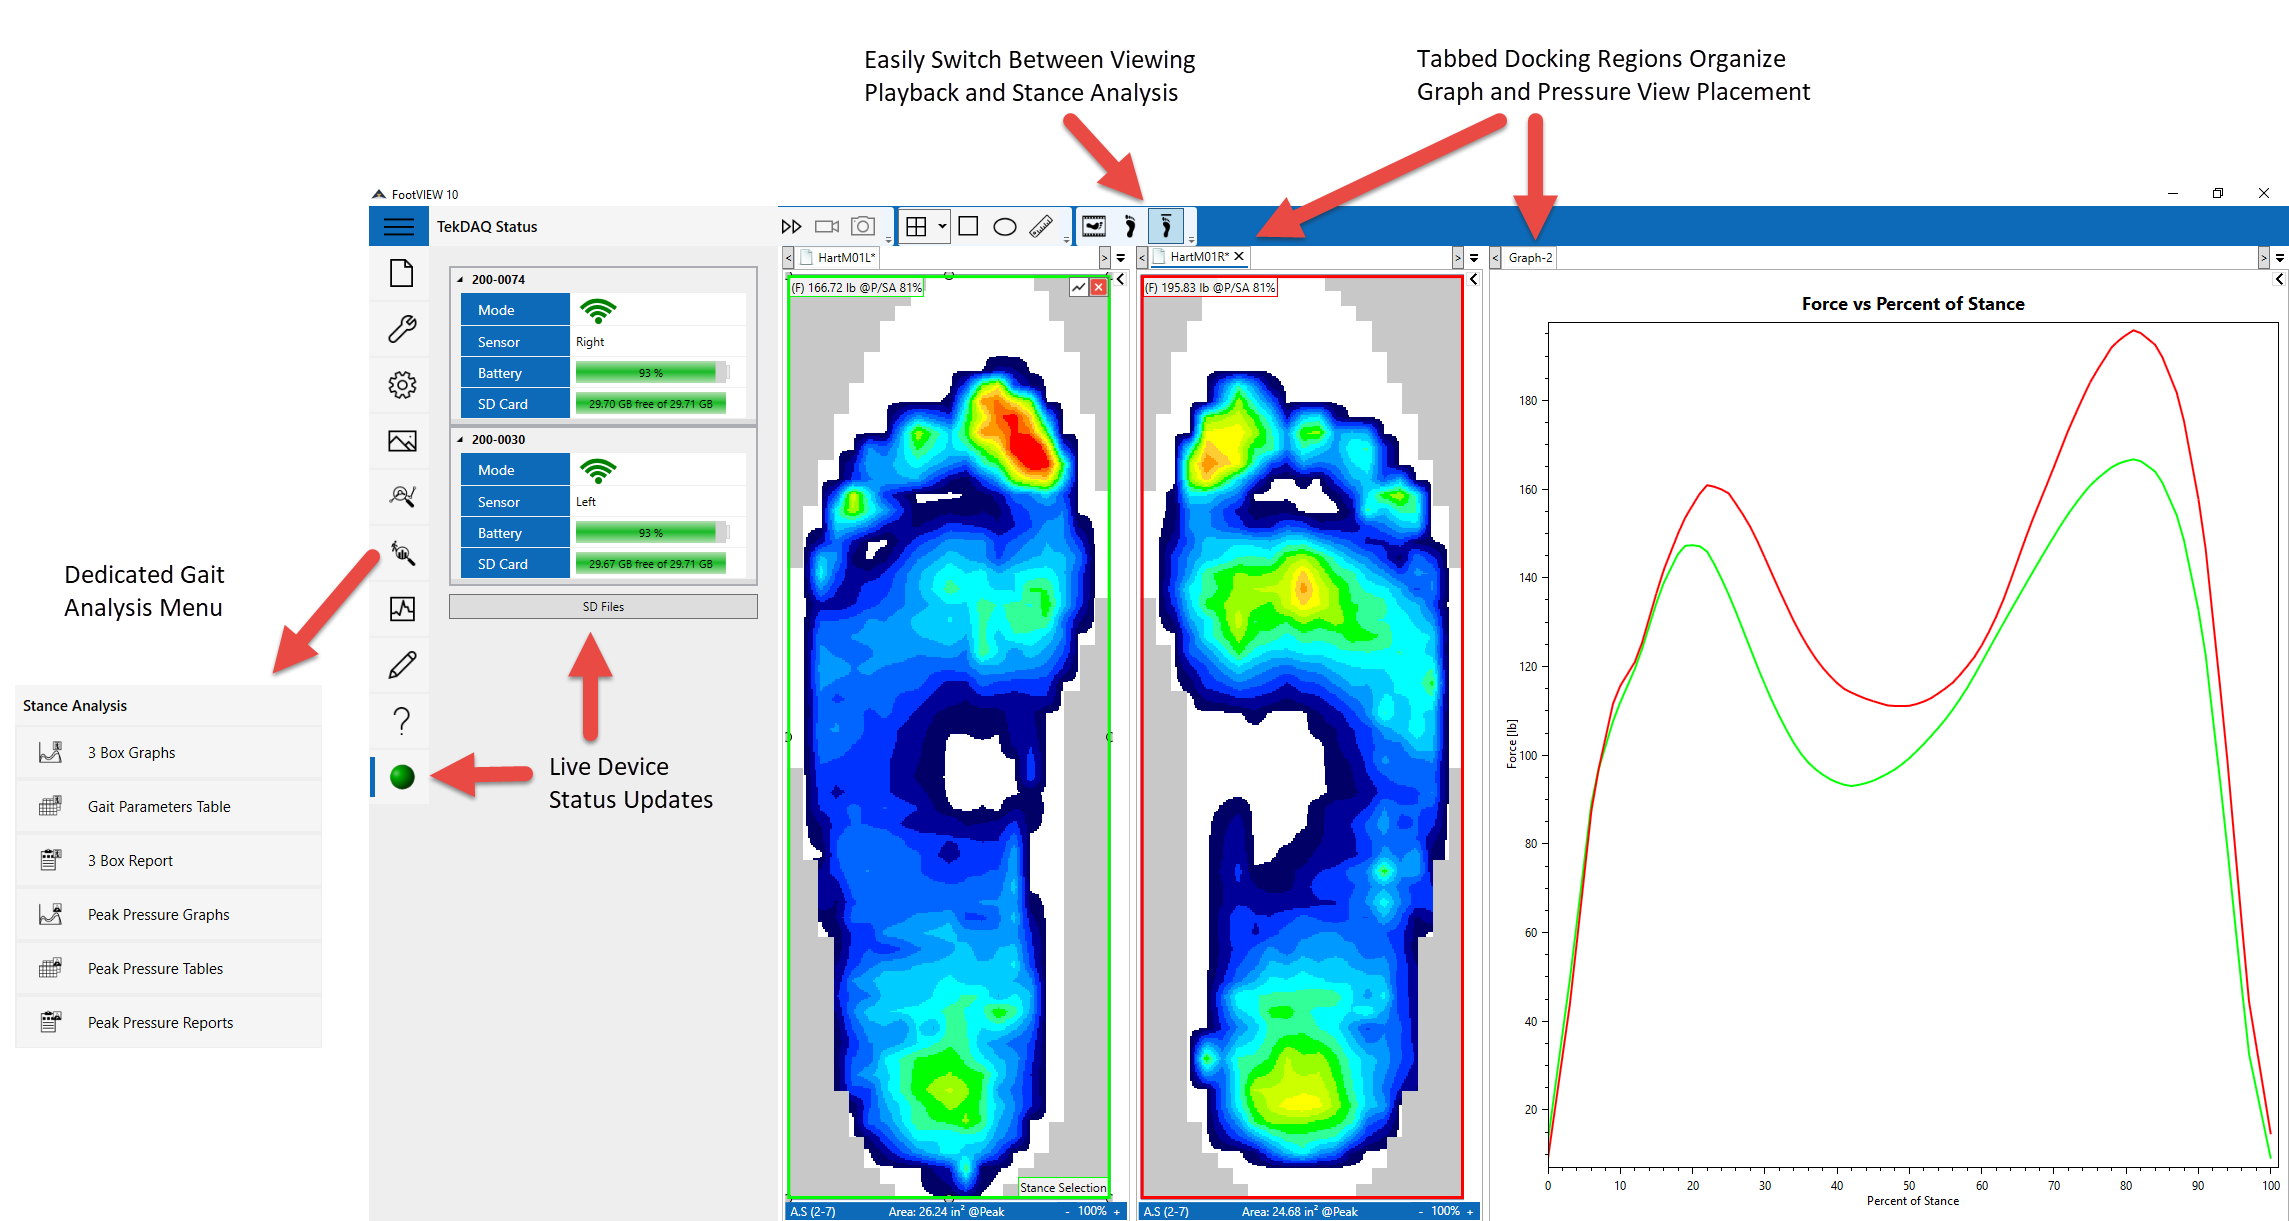
The F-Scan GO works with Tekscan's next generation of software called FootVIEW. The FootVIEW software provides accurate and reliable information for foot function and gait analysis. Key Features:
All Tekscan software works with current Windows® based operating systems. To view the complete computer requirements click here. |
 FootVIEW Sofware for F-Scan GO FootVIEW Sofware for F-Scan GO |
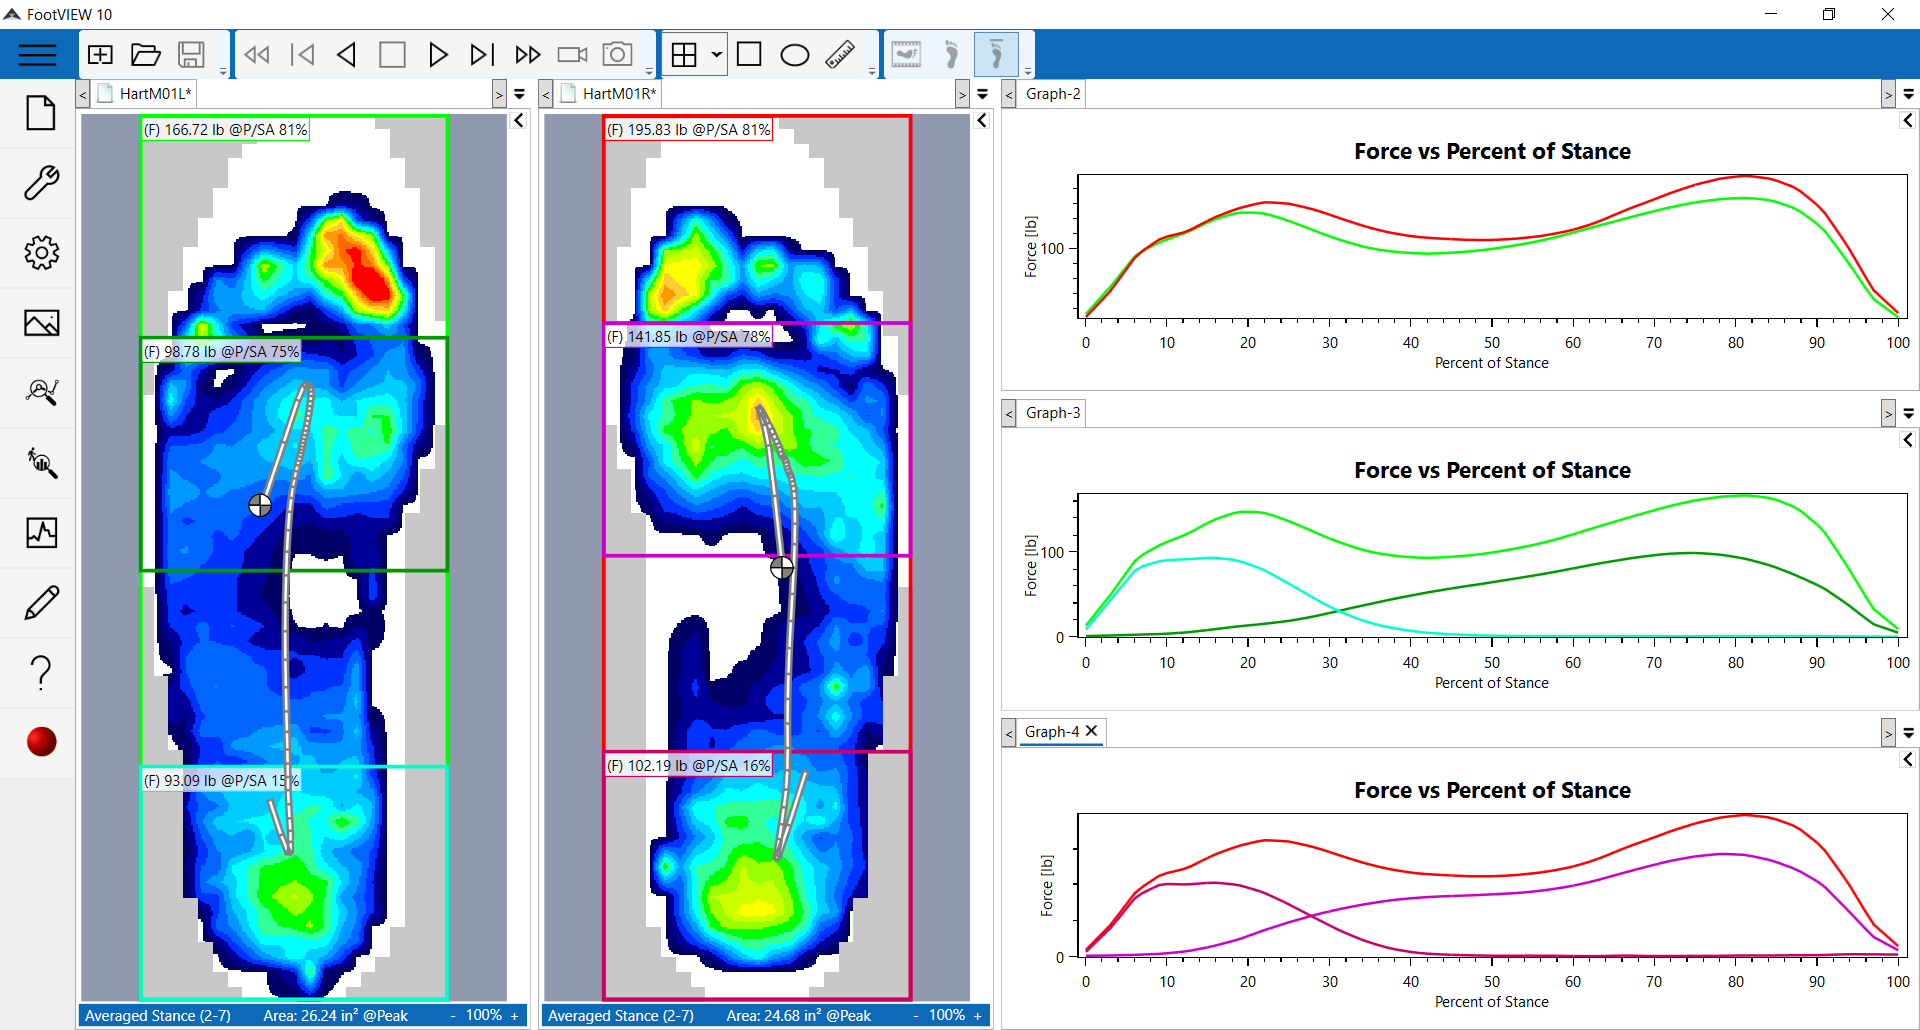
All New FootVIEW Software
|
 |
Save time analyzing data and writing reports with automated analysis
|
 |
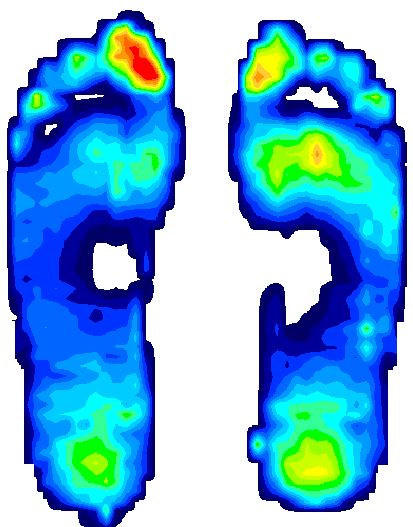
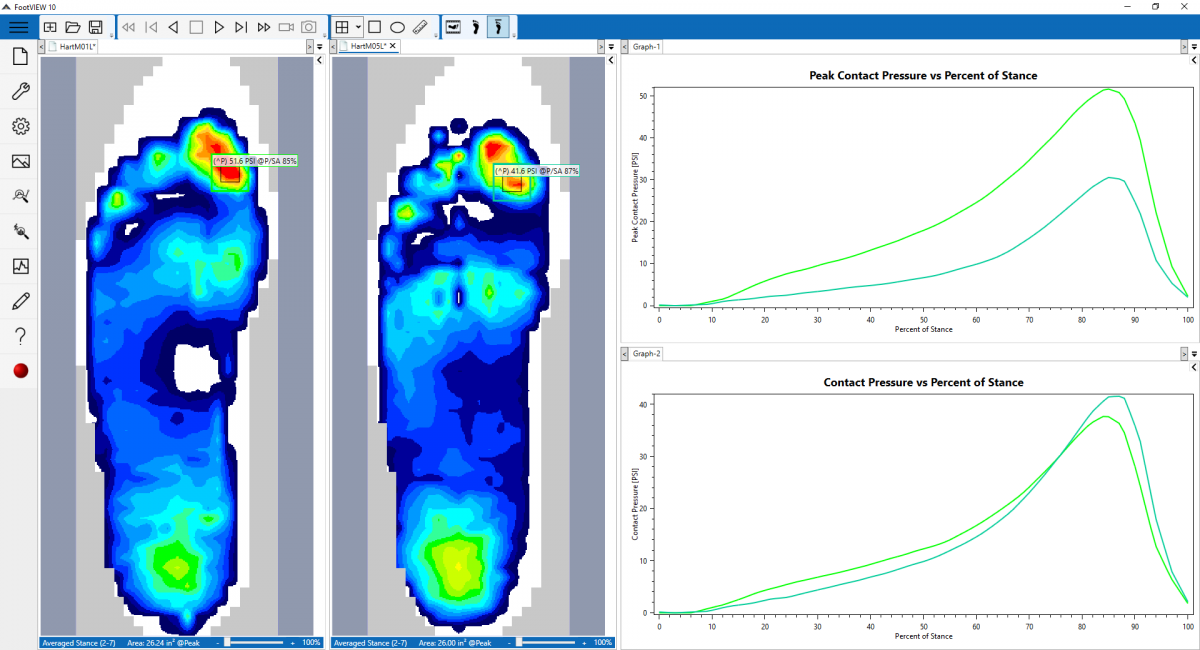
Peak Pressure Analysis identifies and quantifies peak pressure areas
|
 |
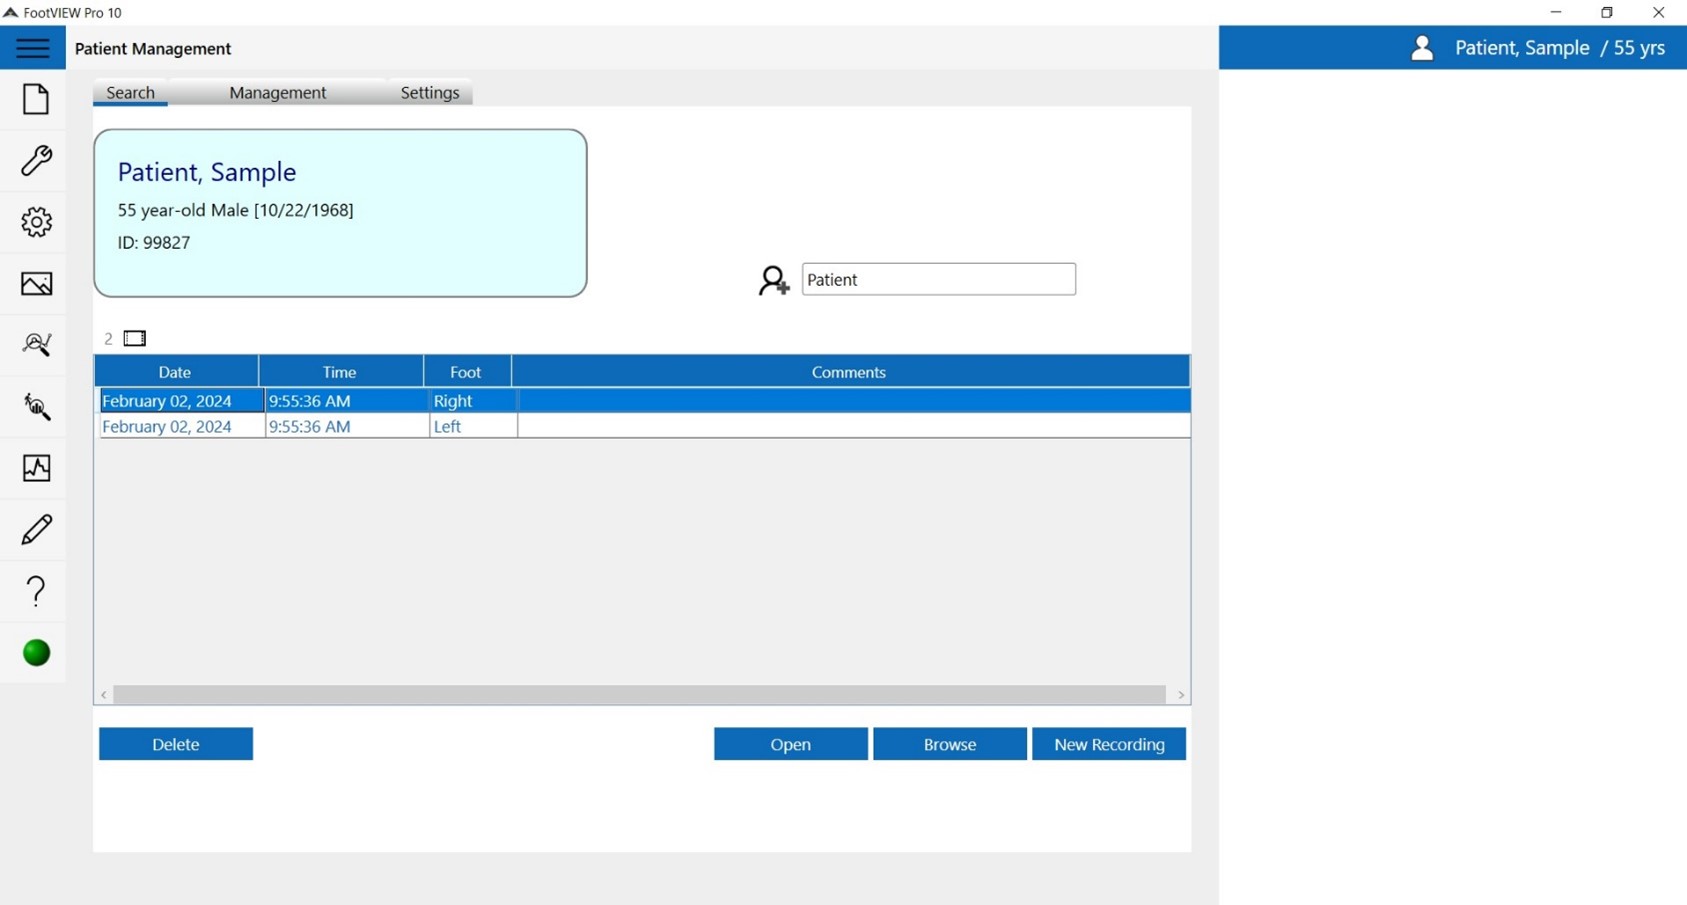
Patient Management
|
 |
The F-Scan GO with FootVIEW Pro was designed for the needs of biomechanics researchers, with features like:
All in a system with the highest sensor resolution and fastest sampling rate (500hz), and sensors a natural gait environment with the thinnest in-shoe pressure mapping sensor on the market at 0.28mm.
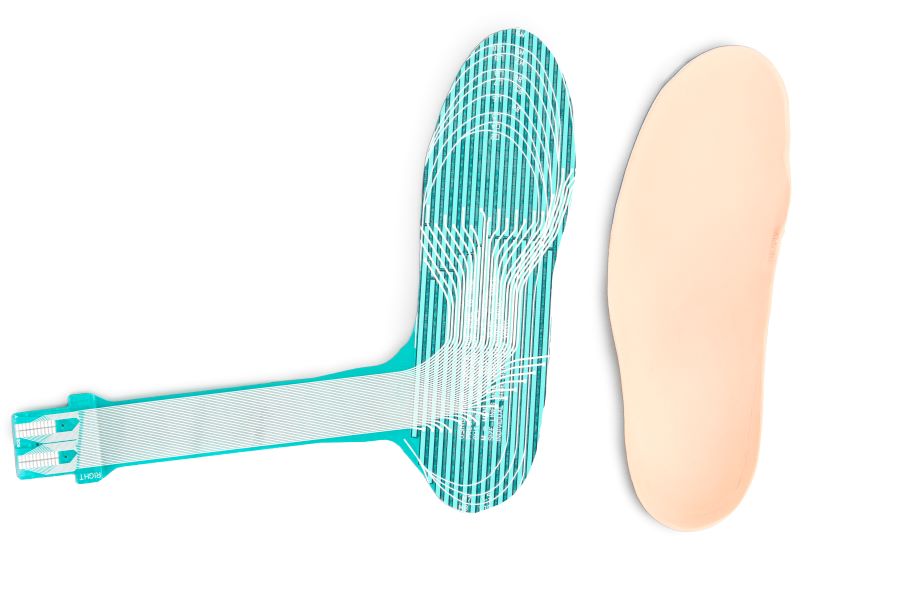
F-Scan GO sensors have optimal spatial resolution for in-shoe pressure measurements, and the highest resolution sensing on the market. The sensors are ultra-thin, yet durable enough to last for multiple trials.
Trimmable Sensors
The standard in-shoe resistive technology sensor used for the F-Scan GO. The new E-Tab sensor is designed for less bulk and easy connection to the electronics. |
"One power of the F-Scan system lies in the immediate and totally obvious visual feedback. Most cases are definitive even without referring to the staggering ability of the software to represent the data in any way you can think of. This simplicity combined with the fact that it is a foolproof means of pre- and post-testing treatment methodology makes this system invaluable to the clinician."
Larry Pace, PTA, CSCS, USA Triathlon Coach, SATORI Physical Therapy & PACE Sports Training, Orange, CA
F-Scan GO TekDAQ Wearable Wifi units have embedded Wi-Fi datalogging capability. TekDAQ units communicate directly with the PC through the included TekDAQ Wi-Fi Router.
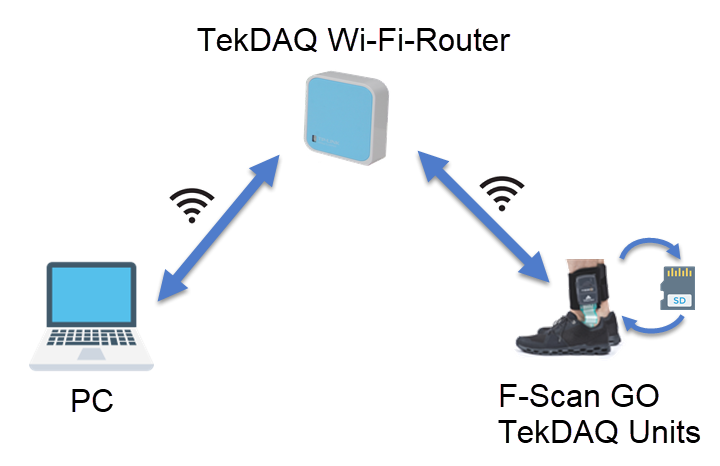
You can watch real time pressure data captured in the software over WiFi while configuring. The FootVIEW software communicates with the devices to capture real-time data, calibrate the sensors and control recording. When you start recording, data is collected directly to Micro SD cards in the TekDAQ units at a sampling speed of up to 500 Hz. At the completion of each recording, the recording data is automatically transferred back to the PC over WiFi to provide immediate access for analysis. This allows F-Scan GO to have the fastest possible sampling speed, even when connected over WiFi.


This eBook explores the complementary technology that could complete your gait lab, enabling a full picture of data for various applications.

Watch this 20-minute webinar to get a deeper understanding of foot function and movement, which will help you identify issues and pathologies in human gait.

Marshall Kendall, PhD, provides an in-depth look into capabilities and methods for using Tekscan's F-Scan in-shoe system, including software tips, and real-world research successes.

Discover which Tekscan gait analysis solution will best fit your practice or gait lab with this guide.

Dr. Howard Dananberg will help you gain greater insight into how the timing and position of limbs in motion can impact loading and unloading.

Discover which Tekscan gait analysis solution will best fit your practice or gait lab with this guide.