by Peter Barrow, BSc (Pod Med), MChS, LLB
Principal at Clifton Road Podiatry Practice, Rugby, UK
Evaluate and Improve Orthotic Outcomes with Pressure Mapping
A keen dog-walker in her mid-forties had not been able to exercise her dog for four months as a result of severe pain in her right great toe joint. She lived out of town and her local practice had prescribed pre-formed orthoses of a type which are sometimes appropriate. On this occasion the devices made things worse. F-Scan™ in-shoe pressure/force system analysis was used to rapidly identify the reason for orthotic failure, and then indicate an instant solution. The new devices were tested for efficacy and were prescribed with full confidence that the pain would be much improved, which it was. The patient was impressed with the speed of analysis and resolution of her problem.
For the patient, there was identification of functional hallux limitus (FHL), exacerbated by the pre-formed orthoses and resolved objectively.
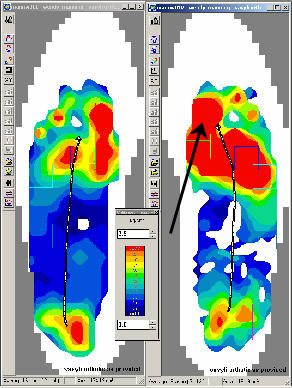
Original Orthoses: F-Scan™ Pressure Profile
In the pressure profiles, left, the original orthoses had 6 degrees varus posts throughout their length. The shell seemed to be preventing adequate plantar flexion of the first rays (big toes), particularly on the right as indicated by the high loading (in red as per the black arrow). Maximum pressure under the halluces (big toes) was 9.7 kg/cm2 for the right and 3.4 kg/cm2 for the left.
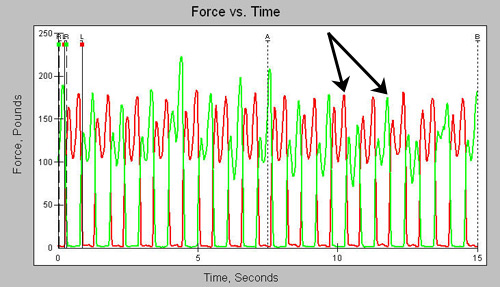
Original Orthoses: Force vs. Time Graph
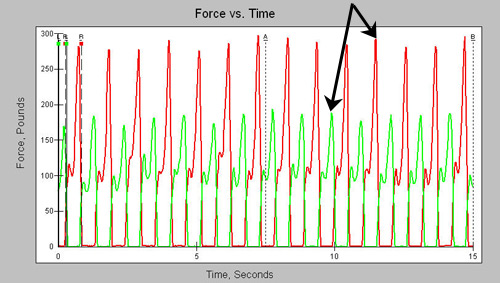
In the Force vs. Time graph right, the Gait (vertical force vs. time) curves are presented for the left and right feet for several foot steps. The curve for the left foot is in green while the curve for the right foot is in red. The second hump (as per the black arrows) on each gait curve indicates the quality of forward rotation of the forefoot at the great toe joint. Note the lack of symmetry, where the right forefoot spikes (red curves) are 45% higher than the left (green curves).
The original devices were then substituted for new orthoses. These were nonposted, preformed, full length EVA. A cut out was provided for the right 1st ray.
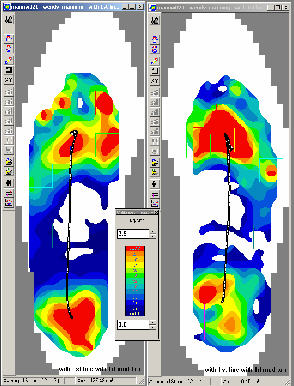
New Orthoses: F-Scan Pressure Profiles
In the pressure profiles above for the new orthoses, FHL was addressed with immediate improvement (as indicated per reduction of loading under the halluces). Objective findings enable the practitioner to predict the outcome. When patients experience the predicted improvement, their confidence in the clinician and practice increases.
New Orthoses: Force vs. Time Graph
In the Force versus Time graph right, the gait curves are more symmetrical. The red forefoot spike is reduced with respect to the left spike (green). Note also that the heel loading represented by the first hump in the curves (black arrows) are also more symmetrical and normal. Further work could include enlarging the cut out and adding a right heel raise. The practitioner can proceed to do this on custom orthotic shells with the patient now having full confidence, even after experiencing initial disappointment with clinician and orthoses.


