Animal Gait Analysis
Tekscan's animal gait solutions provide easy access to essential parameters for identifying lameness and tracking progress.
Have questions? Contact Us
Tekscan's animal gait solutions provide easy access to essential parameters for identifying lameness and tracking progress.
|
Identifying gait asymmetries or lameness in animals often requires more than just a visual assessment. Objective gait data provides the ability to determine precisely which paw or limb is problematic and allows for easy monitoring of progress. Tekscan offers a few options for low profile pressure measurement walkway systems that capture multiple sequential steps for analysis of paw and hoof function and gait. Regardless of which option, they provide objective data for quantified analysis that is used to answer clinical and research related questions about animal gait.
|
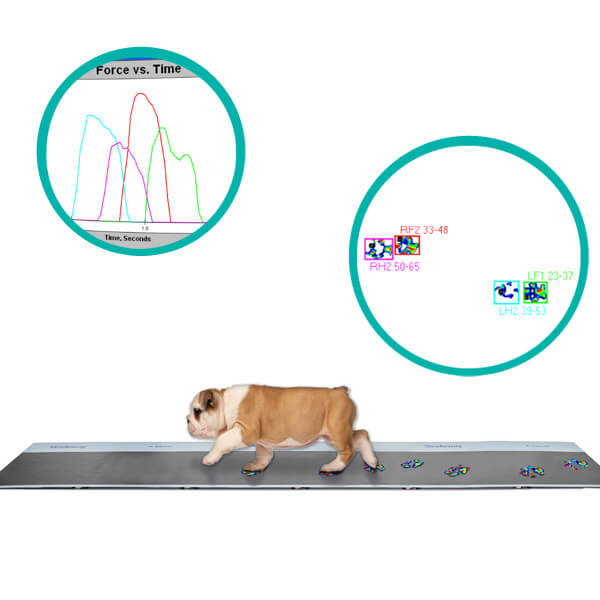
 Easily identify asymmetries in forces between limbs. Easily identify asymmetries in forces between limbs. |
Pressure data can provide incredible insights into factors affecting animal gait, which might otherwise go unnoticed. Easily identify pressure profile discrepancies between front and hind or left and right hooves/paws with Tekscan's animal gait analysis solutions.
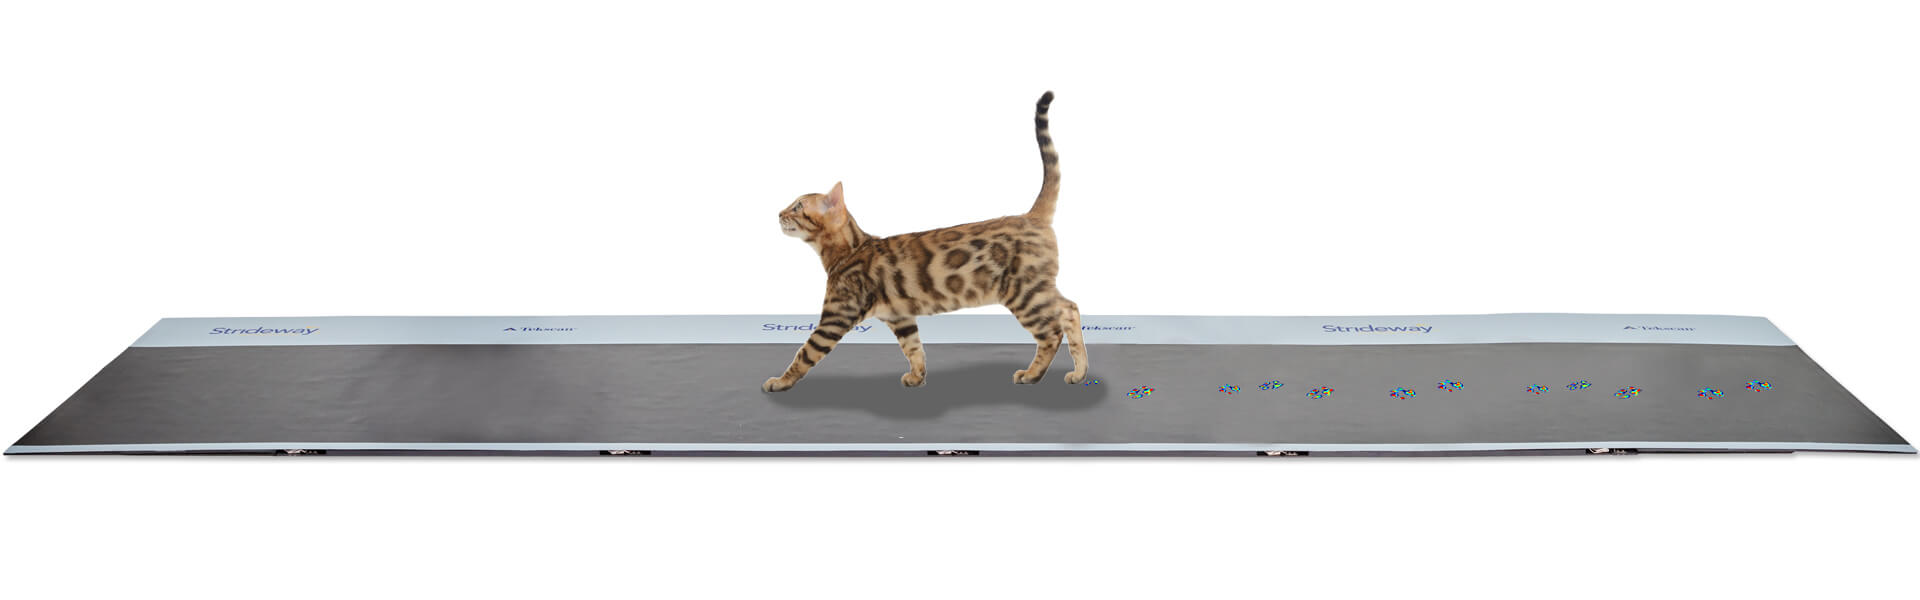
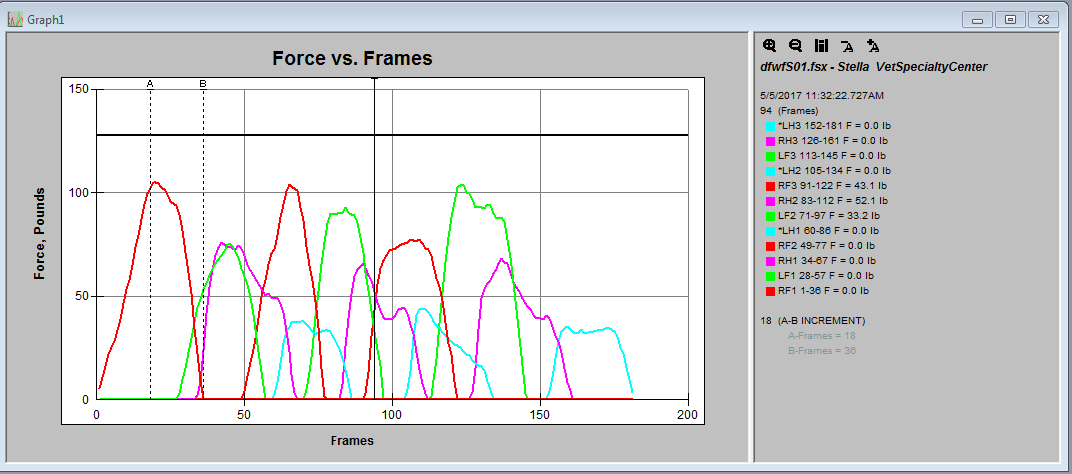
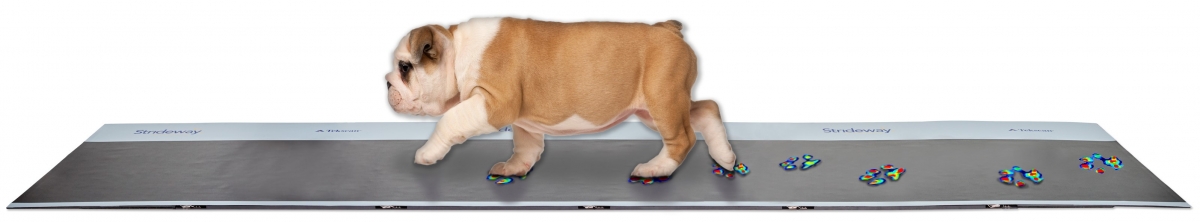 Capture quantitative pressure data that visual assessments cannot with the Strideway system.
Zoe Self Davies (BSc. (Hons), PhD, PGCHE, FHEA) give you a glimpse of her results from a canine walking trial featuring Tekscan technology. Click the video player below to watch.
Webinar: Pressure Mapping for Veterinary ApplicationsIn this webinar, Dr. Zoe Self Davies (BSc. (Hons), PhD, PGCHE, FHEA) will demonstrate different ways to use pressure mapping walkways for canine gait analysis, with principles that can apply to almost any quadruped or biped species. |
 Register for this webinar to see analysis from a real-world canine gait study. Register for this webinar to see analysis from a real-world canine gait study.
|
|
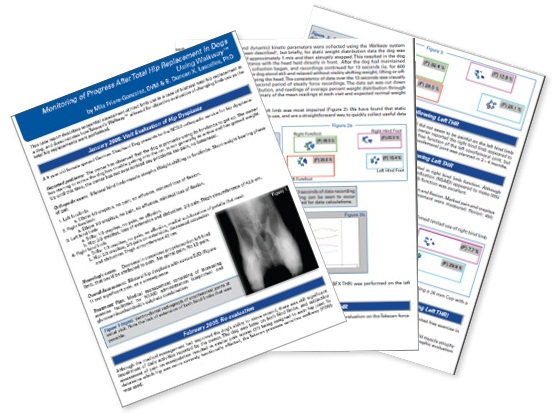
Download this case study to see how Tekscan's animal gait analysis system allowed for objective evaluation of changing limb use after bilateral total hip replacements were performed. |
 |
Learn more about our solutions for animal gait analysis and paw function assessments.
ModularAnimal Strideway System
Strideway is ideal for use with dogs and cats. System is not compatible for animals with hooves |
Don't see a solution that meets your needs? Talk to us about your specific application!
Tekscan's animal gait analysis systems have been used for a variety of different veterinary applications. With multiple resolutions available nearly any size animal can be evaluated from rats to turkeys to cows.

Lascelles, et al. found that Tekscan's Animal gait analysis system, 'was more portable than a force plate system, and certain variables that 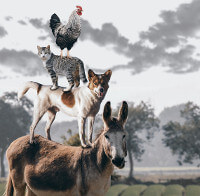 cannot easily be obtained from a force plate system, including stride length and body weight distribution, can be easily measured with the PSW [pressure sensitive walkway] system. Furthermore, measurements from a wider range of dogs with regard to size, and even cats, can be obtained, allowing for investigation of more diverse population groups in future kinetic studies.'1
See other veterinary research published using Tekscan systems in our bibliography.
View Medical Bibliography Now!
1. Lascelles, BD., et al. 2006. "Evaluation of a pressure walkway system for measurement of vertical limb forces in clinically normal dogs." American Journal of Veterinary Research. 67 (2): 277-282.
