Identifying and Correcting for Functional Hallux Limitus
by Bruce E. Williams, DPM
Merrillville, IN
www.breakthroughpodiatry.com
Identifying and influencing function of the 1st metatarsal-phalangeal joint (mpj) is one of, if not the primary component in attempting to bring symmetry to the function of the foot. Functional hallux limitus (FHL or FnHL) can be defined as a non-structural limitation of the 1st mpj dorsiflexion during late midstance and into early active propulsion during the gait cycle. Below, you will see how the F-Scan™ is used to easily identify certain indications from foot pressure profiles and Center of Force (CoF) trajectories when dealing with a functional hallux limitus component, and what to expect when correcting for this problem.
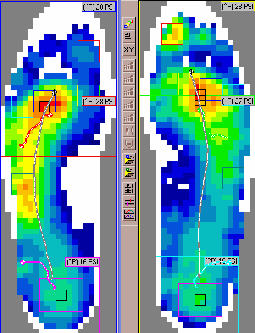
F-Scan™ Pressure Profiles - Before Treatment
In the display, left, notice the deviation in the Center of Force(CoF) progression (gray line). Note the lack of 1st mpj pressure compared to the increased pressures sub 2-4 mpj's bilateral. Also note the increased hallux pressure on the right. In this case, you want to use a 1st ray cutout from the sulcus of the medial aspect of the 2nd metahead, to the base of the 1st metatarsal.
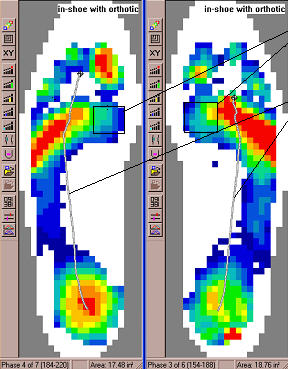
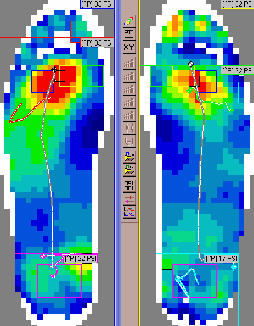
F-Scan Indications of FHL
In the displayed pressure profiles at right, notice the low pressure (within the black box) under both 1st mpjs. Note also the lateral deviation for the Center of Force trajectories (gray line). These are both indications for FHL.
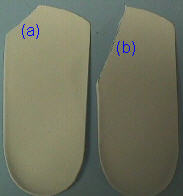
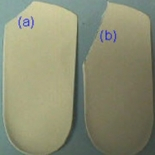
First Ray Cutouts for FHL
The picture at right provides an example of a small 1st mpj cutout (a) and a large 1st ray cutout (b) for a right foot orthotic.
F-Scan Pressure Profiles After the First Ray Cutout
In the display, right, after treatment with a moderate 1st ray cutout in the foot orthotics, notice the more midline progression for the CoF trajectory (gray line). Note also the more equally distributed pressures under the metatarsal heads. There is a definite increase in the pressures sub 1st metahead bilateral.