
How Pressure Mapping Complements Force Measurement in Gait Analysis
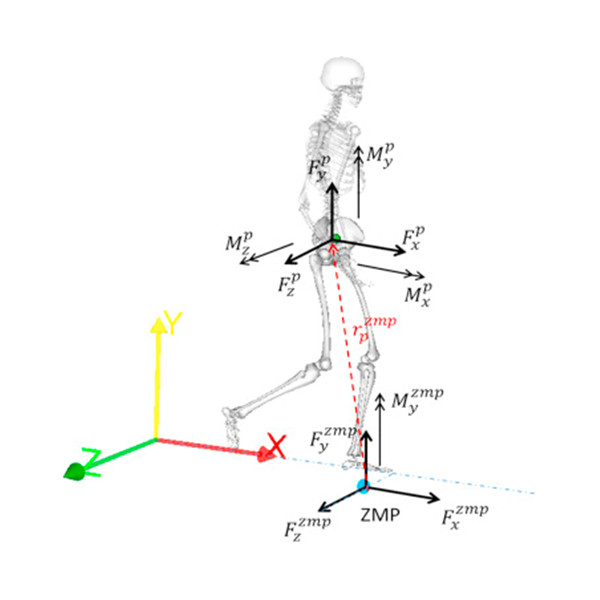
The analysis of human movement provides important information when trying to improve athletic performance, evaluate rehabilitation from an injury, or work towards injury prevention. Human motion is typically described using Kinetic and Kinematic characteristics. Kinematics characteristics include distances, velocities, accelerations and trajectories of given segments or objects, while external and internal forces and torques represent kinetic characteristics. Understanding the forces exerted on the body during motion is one important piece of the puzzle to help understand how different segments of the body are loading. Force plates and pressure mapping systems are two commonly used tools to help quantify these forces exerted on the body. Choosing to use one technology over the other is dependent on the type of questions you are looking to answer.
|
|
|
In order to ensure quality of the data, force plates usually need to be secured to a level surface and not moved again until the testing is complete. Some more portable Force plates are available, but they must still be placed on level surfaces to ensure accurate and reliable data. This can be challenging in sports environments or outside of a controlled lab space.
Force Plate Alternatives
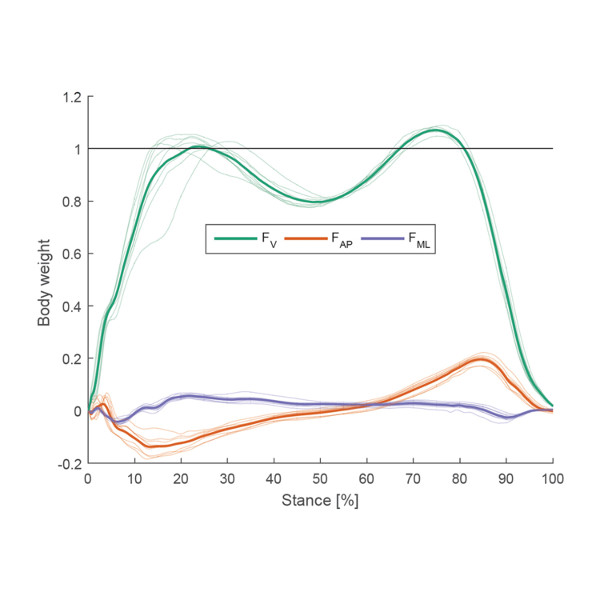
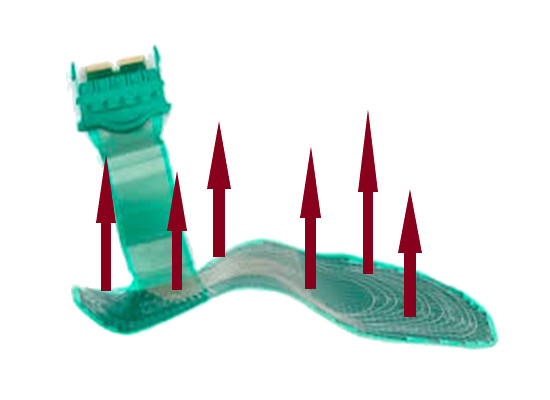
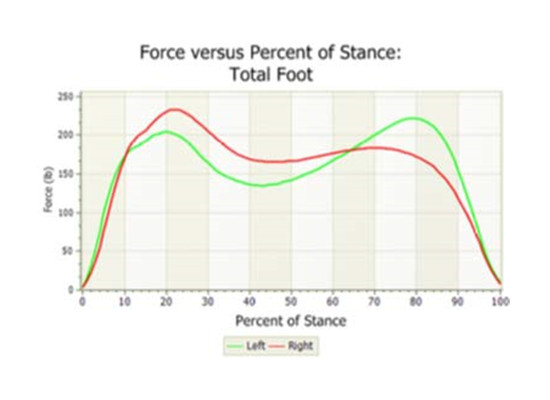
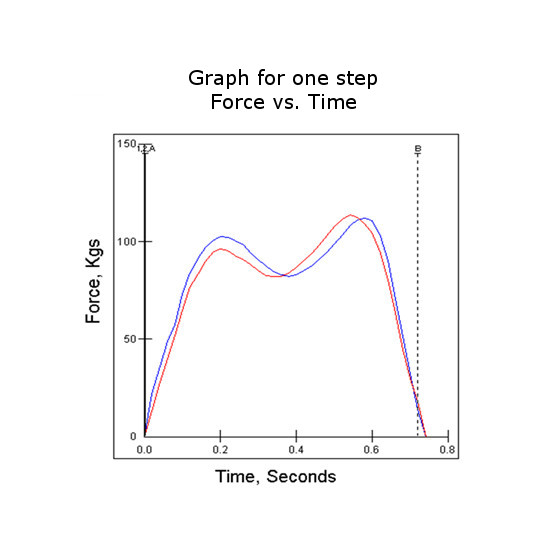
An alternative and complementary solution to gathering ground reaction force information are pressure mapping systems. These systems come in a number of different form factors (mats, walkways, and in-shoe sensors). Pressure mapping systems tend to be more portable than force plates. They can provide similar kinematic and kinetic information to a force plate, but with a few key differences. Pressure mapping solutions measure the vertical force component only of the ground reaction forces. This force measurement is calculated and summed from hundreds of small resistive capacitors within the sensor (Figure 2a). From the summed force measurements a total force versus time curve for both the left and right foot is displayed (Figure 2b).
|
|
|
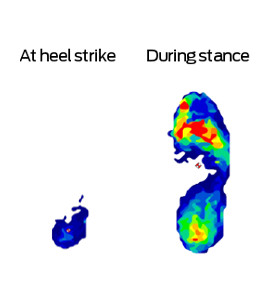
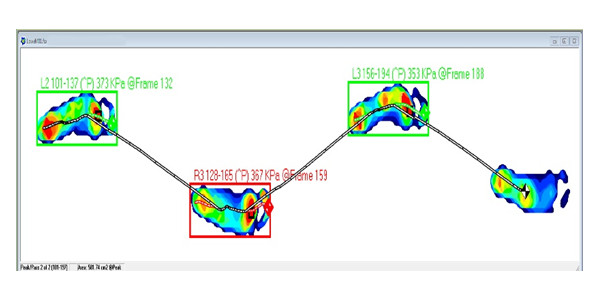
Similar to force plates, pressure mapping solutions can calculate most temporal/spatial gait parameters and CoF/CoP information during various motion activities. The benefit of pressure mapping solutions reside in their ability to show a graded pressure display of the foot during the movement being measured (Figure 3a). This gives the user the ability to break down foot function into different phases of gait and gain a better understanding of how the forces and pressures are dispersed under the foot at different phases. From a sports/athletic perspective, this information gives researchers or coaches insight to the different techniques the athlete may be using to perform a particular action (i.e. forefoot or heel to toe runner; cutting techniques).
|
|
|
Pressure Mapping for Foot Function Analysis
Because pressure mapping systems have such a high resolution of force sensing elements, it is possible to isolate specific regions under the foot. This can be helpful in understanding where foot function may be affected during the stance phase of gait.
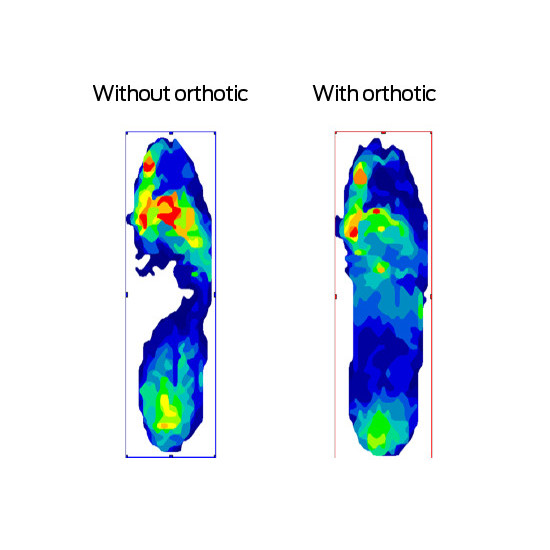
Let's look at the example below of a right footstrike using an in-shoe pressure sensor with and without an orthotic. The pressure profile displays show quite a big difference in how the pressure is distributed. There is less red (high pressure) in the metatarsal regions with the orthotic condition versus the non-orthotic condition, and the medial arch is now filled with blue (low pressure) in the orthotic condition. However, when we look at the total vertical force versus time curves, which would be similar to one you would find with a force plate, the two forces curves (left and right feet) look fairly similar and likely present no real significant differences from one another.
|
|
|
Foot Segmentation Capabilities
Now, let us look at the same example with the feet broken down into two regions (Figure 5). By breaking down each foot into a heel and metatarsal region, we can now see some significant differences in the force versus time curves. In fact, you can see a difference in the curve shapes and peaks from both the heel and metatarsal regions when comparing the no orthotic and orthotic conditions. Looking at the pressure mapping display, it is easy to understand why there was a reduction in forces in those regions by simply looking at the medial arch. With the additional medial arch support from the orthotic condition, forces and pressure in the metatarsal and heel regions of the foot are reduced and the as the medial arch region takes on more.
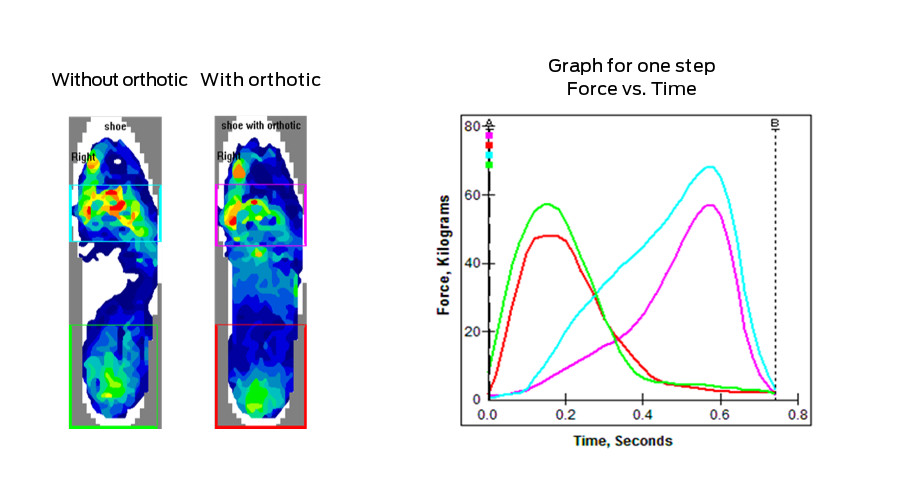 Figure 5 - Force versus time curves and pressure profiles for the same right foot before and after treatment, except the foot is broken down into a forefoot and heel segmentation. Differences in both heel and forefoot force/time curves are now much more apparent
The ability to section the foot down to specific regions is key to helping understand foot function. While force plate offers the total force versus time curves (see figure 4a), they are not able to provide the pressure profiles of the foot, and ultimately characterize foot functions in the fashion shown above. This type of information can be crucial for researchers looking at different pathologies in gait that are characterized by prolonged heel contact (equinus or functional hallux limitus to name a few) or high-pressure areas associated with ulceration (diabetic foot or limb salvage). This type of information can also be crucial to injury prevention, return to play post-injury, and for coaching athletes to use proper technique.
Whether you are looking to do core research in gait or athletic performance where three-dimensional forces are required for a data collection, a pressure mapping system can provide additional information which can be synchronized with the force plate data to enhance the information.
If you are considering technology to enhance your gait research, monitor gait rehabilitation or provide tangible information related to specific foot function techniques in athletic coaching, pressure mapping can be a great portable and cost-effective tool to achieve this.
This article was written by Marshall Kendall, PhD
Learn more about how pressure mapping can complement your existing gait lab technology in this eBook.